TAGS: Share value analysis
Free Subscription: Subscription is necessary to receive an email when market reviews are posted.
News in Brief
Bloomberg:
- Stocks fluctuate as Asia weighs oil inflation risk.
- Bonds rise as factory data temper inflation angst.
- Morgan Stanley strategist says US tech stocks’ rally is overdone.
MarketWatch:
- The surprise OPEC+ oil production cuts will increase gas prices.
- Opinion: Putin shuts off the gas? Europe is not only surviving the energy war against Russia – Its winning.
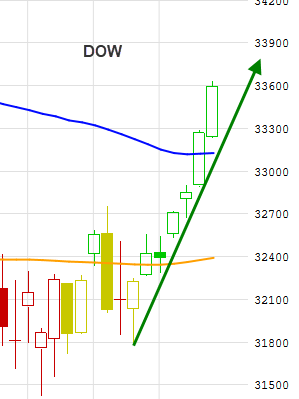
- Dow closes up by more than 300 points after surprise OPEC+ production cut.
yahoo! finance:
- Oil pops, Dow jumps, tech lags as Q2 starts with a bang.
- Back to $100? Oil price forecasts rise on shock OPEC+ cuts.
- Virgin Orbit’s future in ‘substantial doubt’: filing.
- McD’s closes US offices ahead of planned layoffs.
The news causes a lot of volatility in markets while a trend line removes that volatility. The trend is your friend!
Global Indexes
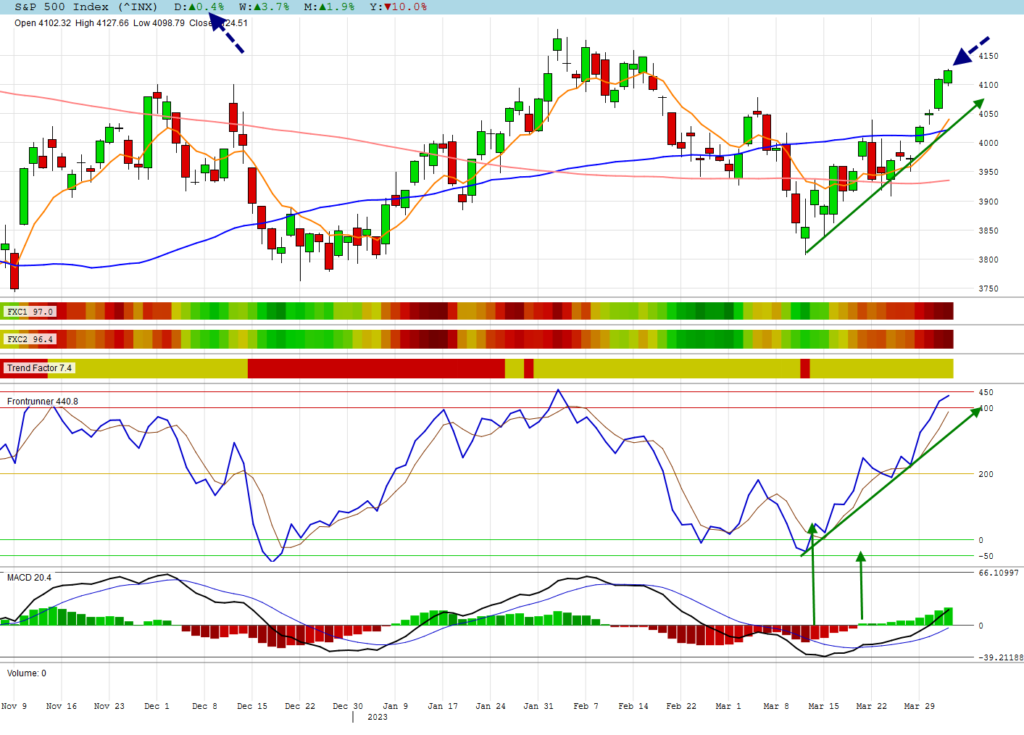
S&P 500
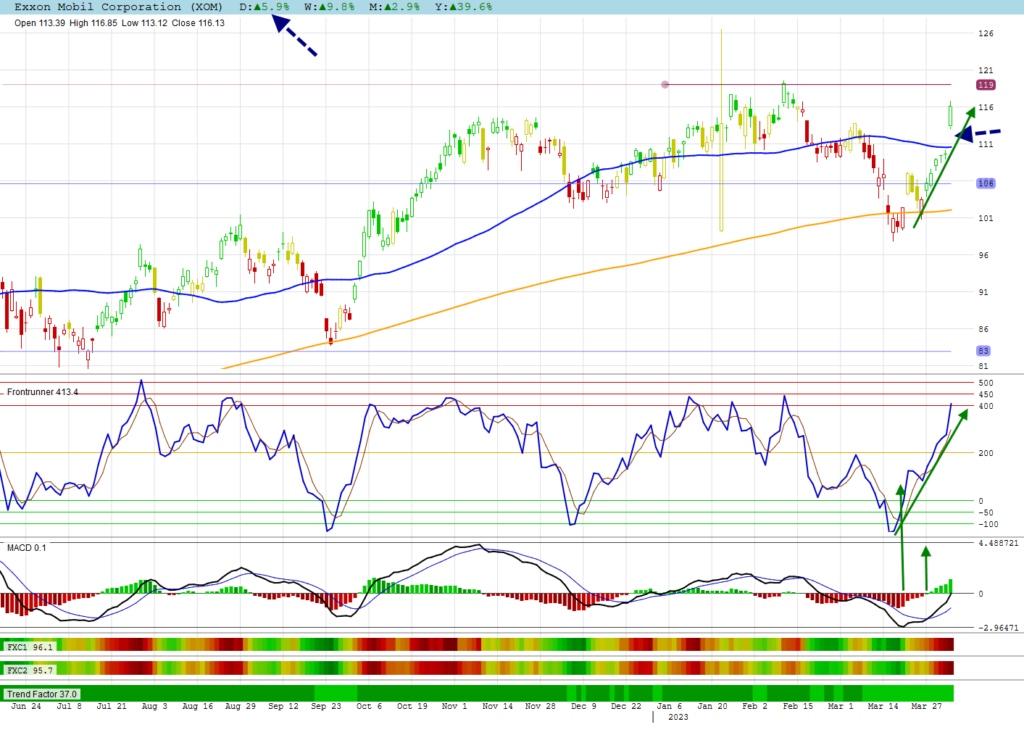
The bull trend for S&P 500 remain intact. Factors for a trend is a simple trend line on the price chart and Frontrunner. Trend starts are when the MACD change color in extreme situations with a Frontrunner break. A simpler system is when the MACD turns green and stay with it until it turns red.
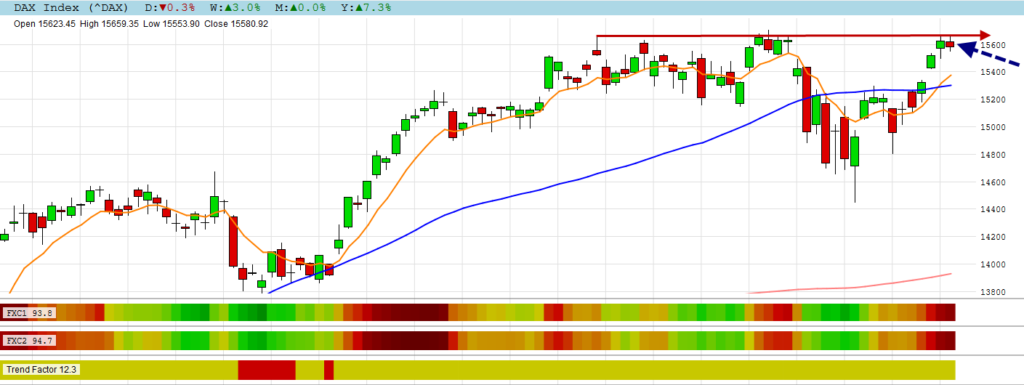
DAX
The DAX is hesitating at strong top resistance. We will have to wait to see if it can break it.
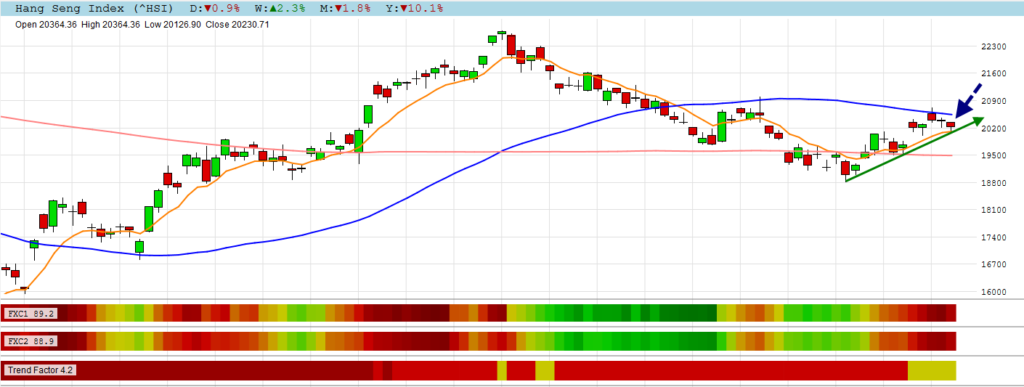
HANG SENG
Its 50-day moving average is acting as strong resistance for the HANG SENG. It is touching its positive trend line and EMA8 line at the bottom acting as support. Support or resistance needs to be broken for trend confirmation.
NYSE & NASDAQ Stocks
Exxon Mobil Corporation
Most oil companies made a gap like Exxon Mobil. I marked the trend start on the graph as explained under the S&P 500.
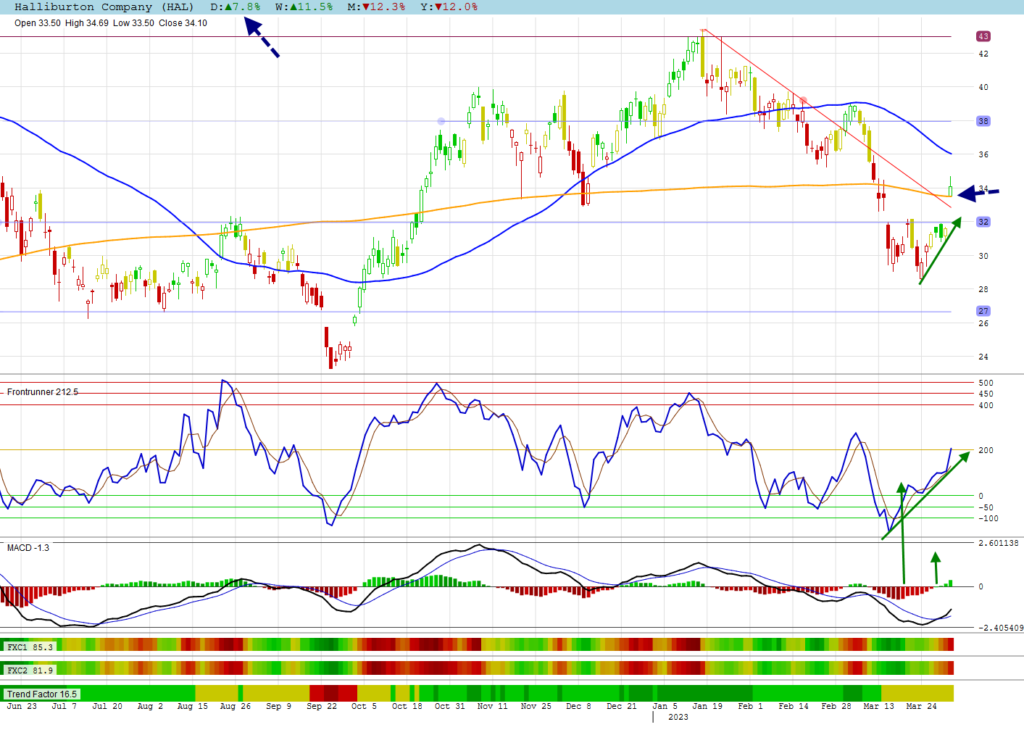
Halliburton Company
Halliburton also made a gap to break its EMA8 and negative trend lines. A frontrunner break with a MACD changing color would have given you the edge.
JSE Stocks
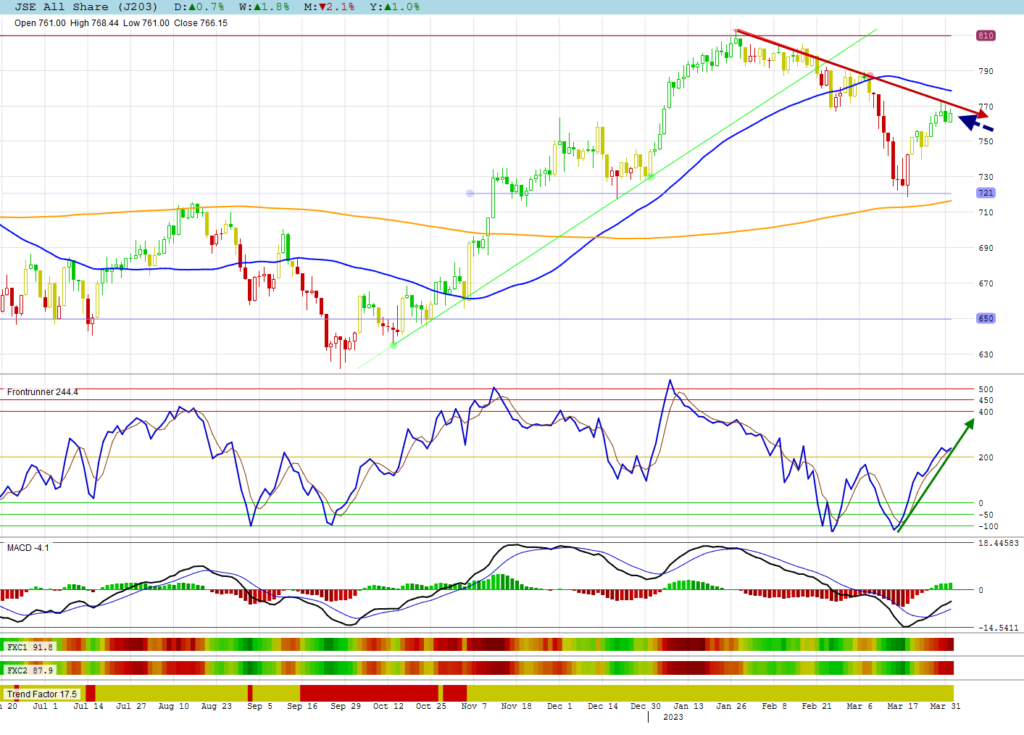
JSE All Shares
The negative trend line of the JSE All Shares is still acting as resistance. Notice where the MACD changed color with a Frontrunner break.
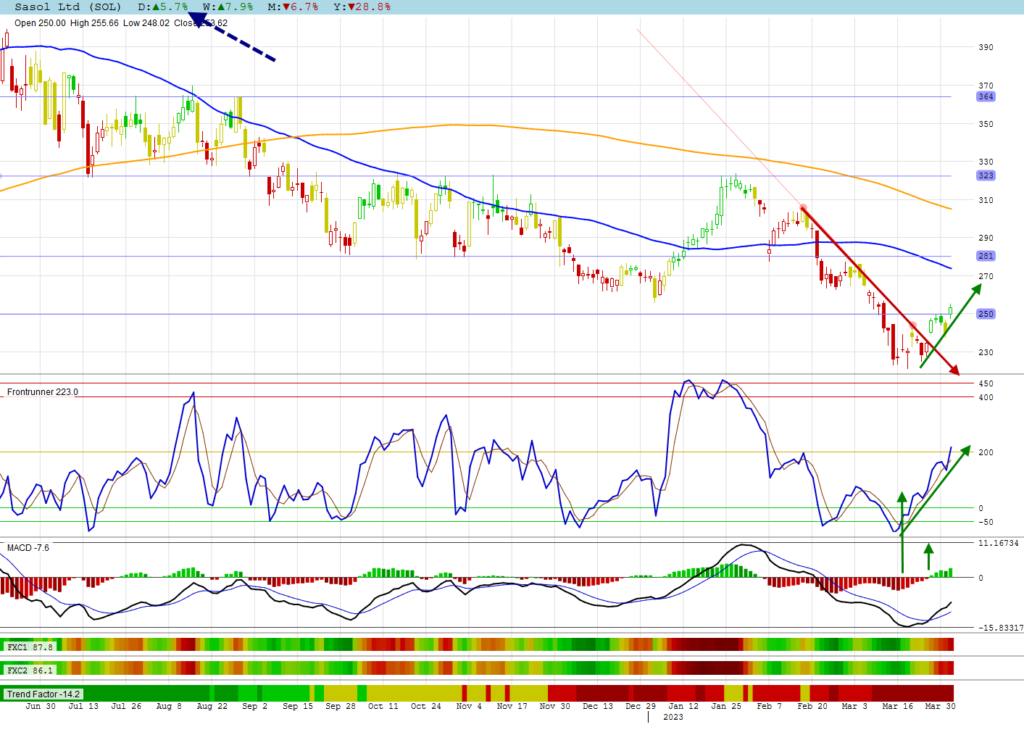
Sasol Ltd
Sasol made another gap. I marked the simple system on its graph where trend change took place. The breakaway gap broke its negative trend line.
Algomodel Strategies, Education & Features
Click on Education or go to the home page to view education posts.
Frontrunner, Gaps, Trend and Cyclic Indicators are explained in these education posts.
All stock graphs are shown with a Trend Candles Template which is a feature available in Algomodel Signals Pro.