
Bloomberg:
- BofA says take profit on ‘Bear Rally’ as stock outflows resume
- Musk says inflation is ‘Past Peak’ as parts costs trend down
- Tesla takes pause from months-long rally as investors clear 3-for-1 split
MarketWatch:
- Stifel’s Barry Bannister raises S&P 500 target to 4400 for 2022 and prefers ‘cyclic growth’ stocks
- U.S. stocks close mostly lower as robust July jobs report stokes worries over Fed rate hikes
- Alibaba earnings highlight ‘attractive turnaround story,’ though stock gives back gains
yahoo! finance:
- Yields surge, stocks close mixed after July jobs report
- DraftKings’ CEO isn’t worried about inflation
From the news it is clear that everyone has his own opinion about where markets are heading too. We want to show in this market review that top resistances are not easily broken.
Global Indexes
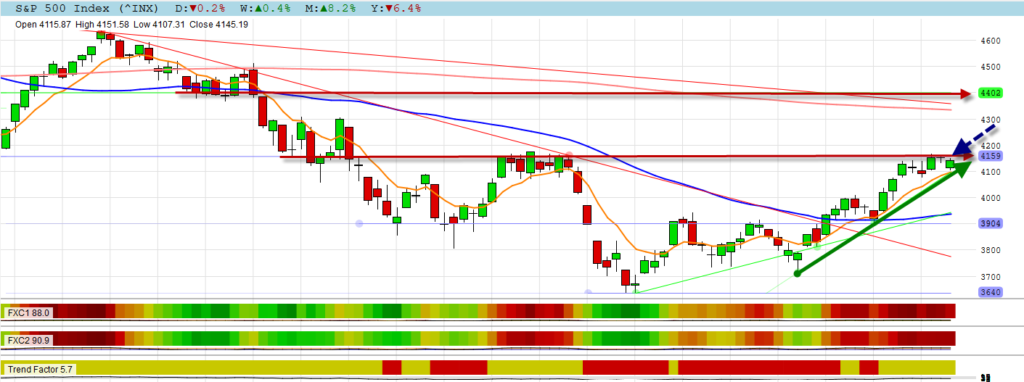
S&P 500
The S&P 500 is hesitating at the current resistance with none of the supports broken. Notice where the 4400 resistance is as mentioned as a target for 2022.
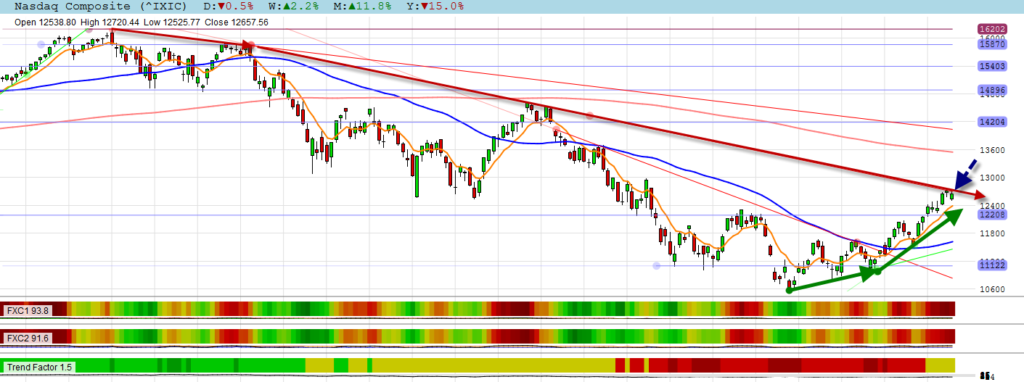
NASDAQ
The NASDAQ is also at a critical long term resistance in overbought territory. We will know soon if this resistance will be broken?
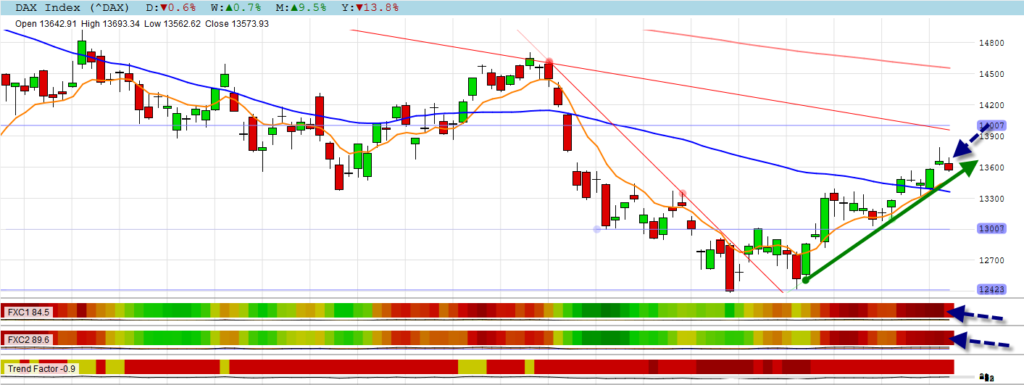
DAX
The DAX is also in overbought territory and made a correction after the inverted hammer candle.
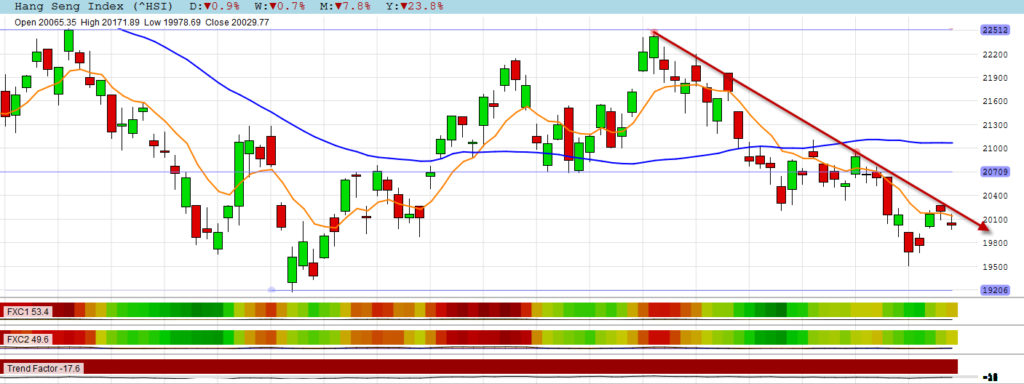
HANG SENG
The HANG SENG is bouncing down from its strong negative trend line.
NYSE & NASDAQ Stocks
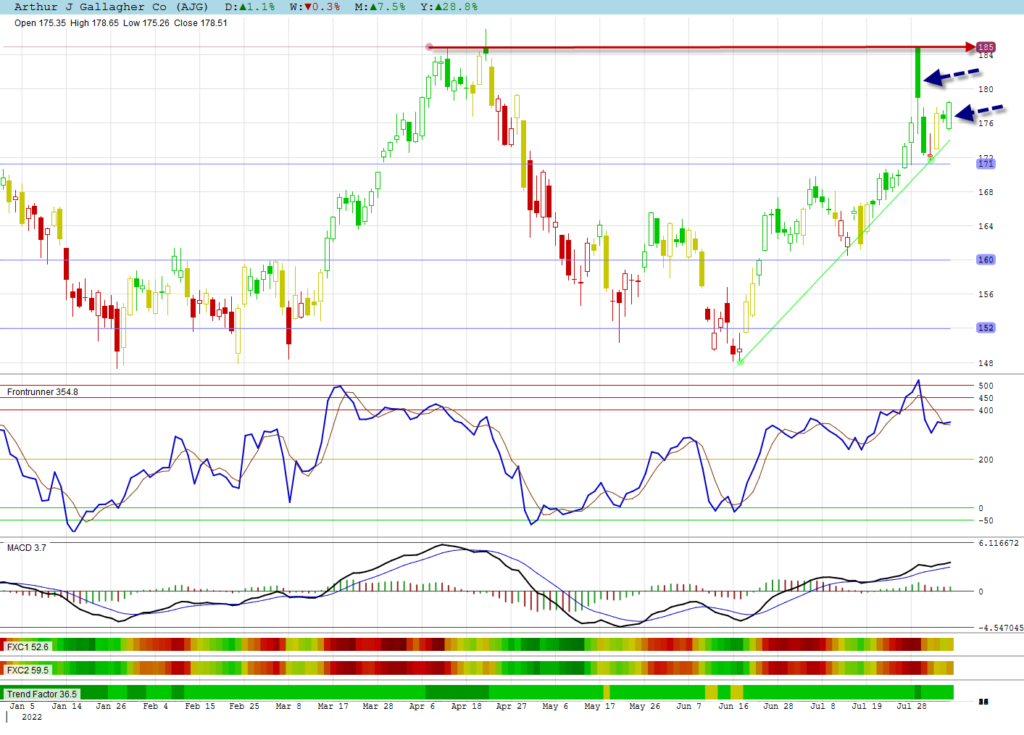
Arthur J Gallagher Co
The first top resistance share I want to show is Arthur J Gallagher Co. On the day it touched its $185 resistance, it immediately started correcting to $172. It is currently building up steam to make another attempt at the top resistance.
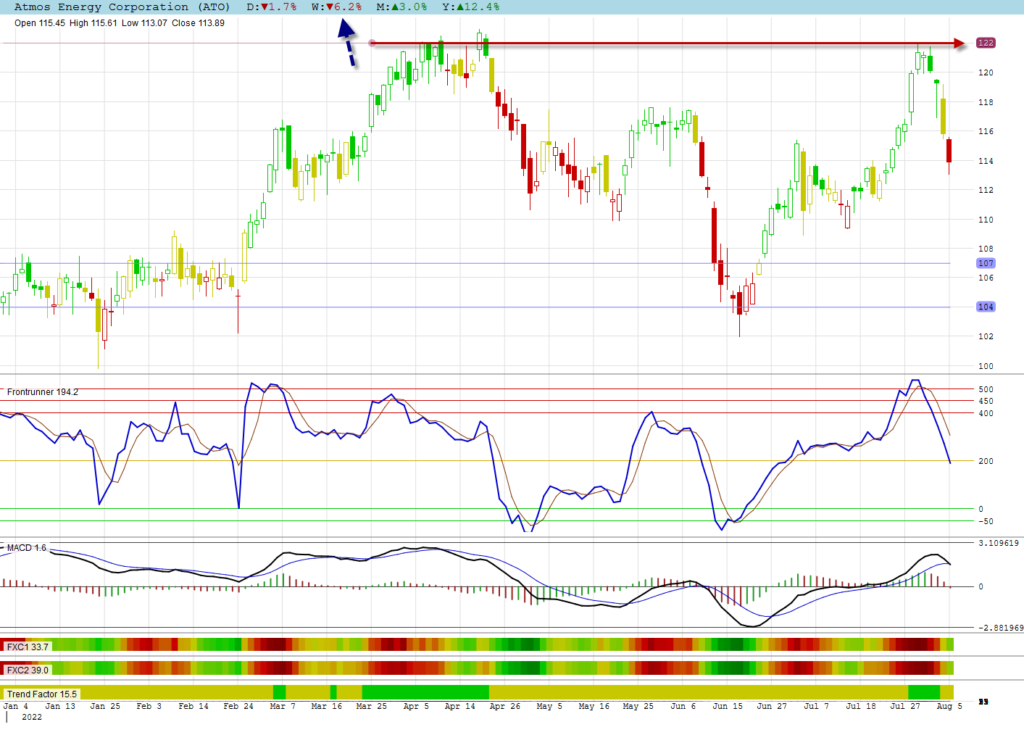
Atmos Energy Corporation
Immediately after Atmos Energy Corporation touched the $122 top resistance, it started correcting. It is still busy with the correction without any sign of a turn. Never underestimate top resistances. I draw all top resistances for shares in my watchlists in a different color to remind me that it is a top resistance.
JSE Stocks
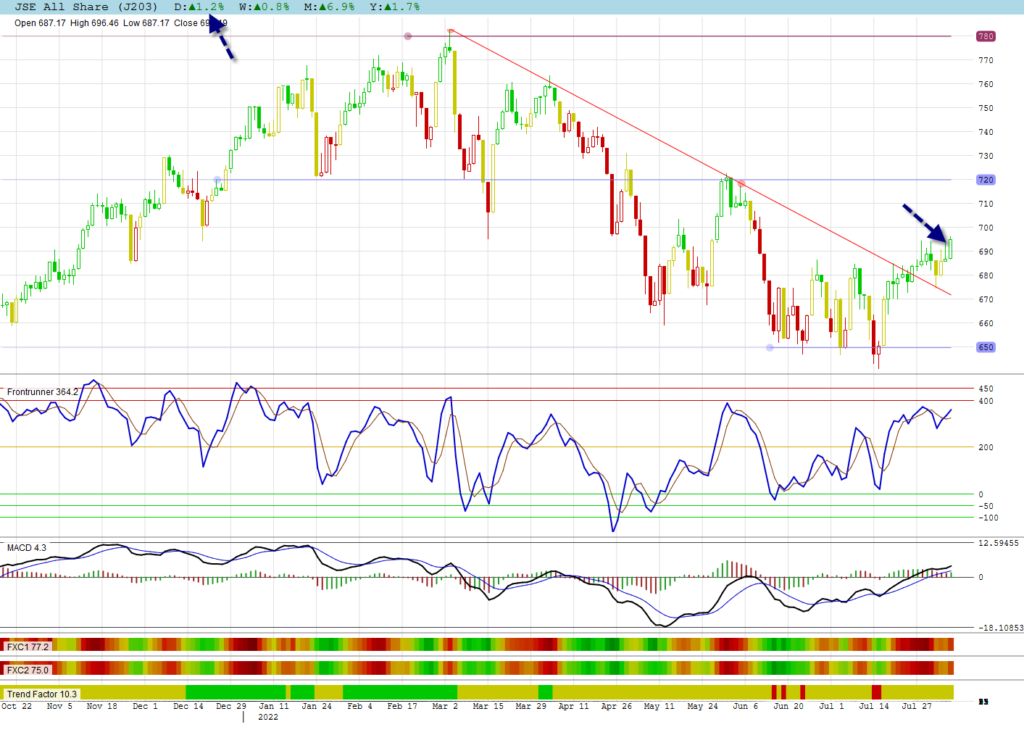
JSE All Shares
The inverted hammer candle of the JSE All Shares was not confirmed and the JSE actually had a positive day.
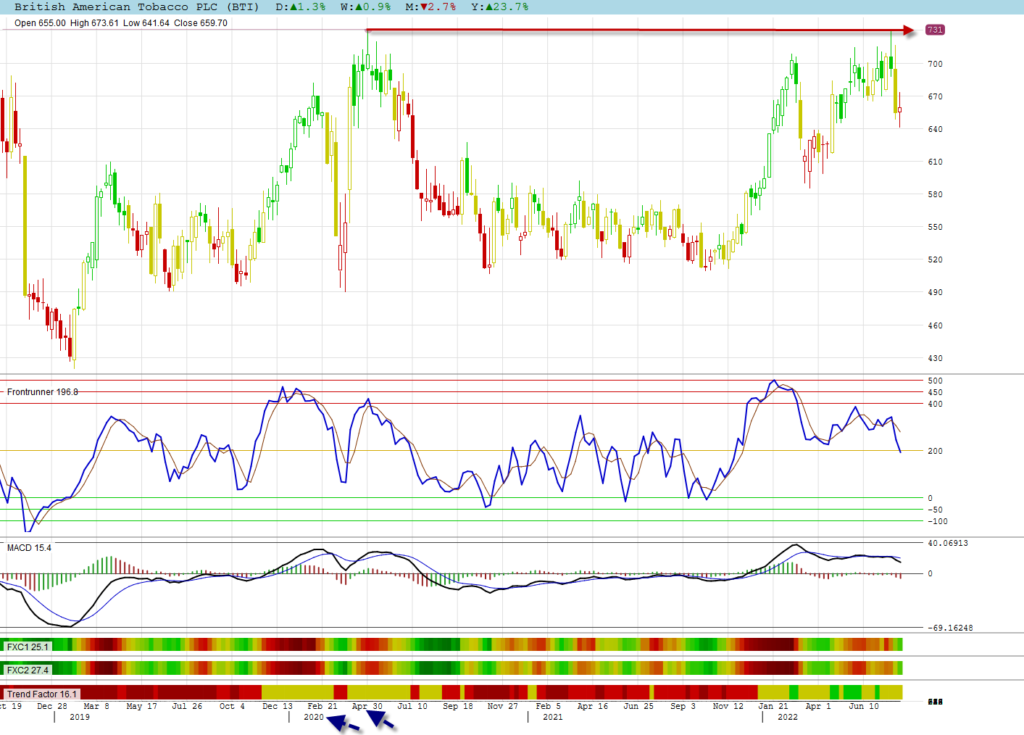
British American Tobacco plc
For British American Tobacco its weekly chart is shown as the top resistance was created in Apr 2020. After touching it, it also immediately started correcting.
Algomodel Startegies, Education & Features
Click on Education or go to the home page to view education posts.
Frontrunner, Gaps, Trend and Cyclic Indicators are explained in these education posts.
All stock graphs are shown with a Trend Candles Template which is a feature available in Algomodel Signals Pro.