Frontrunner is a proprietary technical signal of Algomodel and is only available in Algomodel Signals Pro.
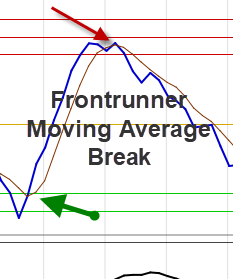
Moving Average Break
The breaking of an indicator’s moving average is a well known phenomena. The problem with it is that you can get many false signals and if you follow all the signals, you will not make progress with your portfolio. The best way to use moving average breaks is to combine it with other confirming signals.
Combining Moving Average Breaks
1 Combining with a trend line: One way to counter all the false signals is to draw a trend on the tops or bottoms of the indicator and also wait for this to be broken as confirmation. Trend lines can also be drawn on the price chart for a similar break.
2 Combining with Candles: Confirmation with turning candles are also a useful tool. Check if the break coincide with turning candles like: Hammer, Doji, Engulfing Bull, Rickshaw Man, Morning Star, Evening Star or any other turning formations.
3 Rising Bottoms or Falling Tops: Another way is to check if you have a rising bottom with the average break for positive moves or falling tops for a negative move. This scenario is very similar to divergence as discussed in Lesson 1.
4 Extreme Levels: Check if the average breaks is occurring in oversold territory for positive moves or in overbought territory for negative moves. A Power Signal was created in Algomodel Signals Pro using this method and is discussed in a later lesson. This scenario is not shown in the examples.
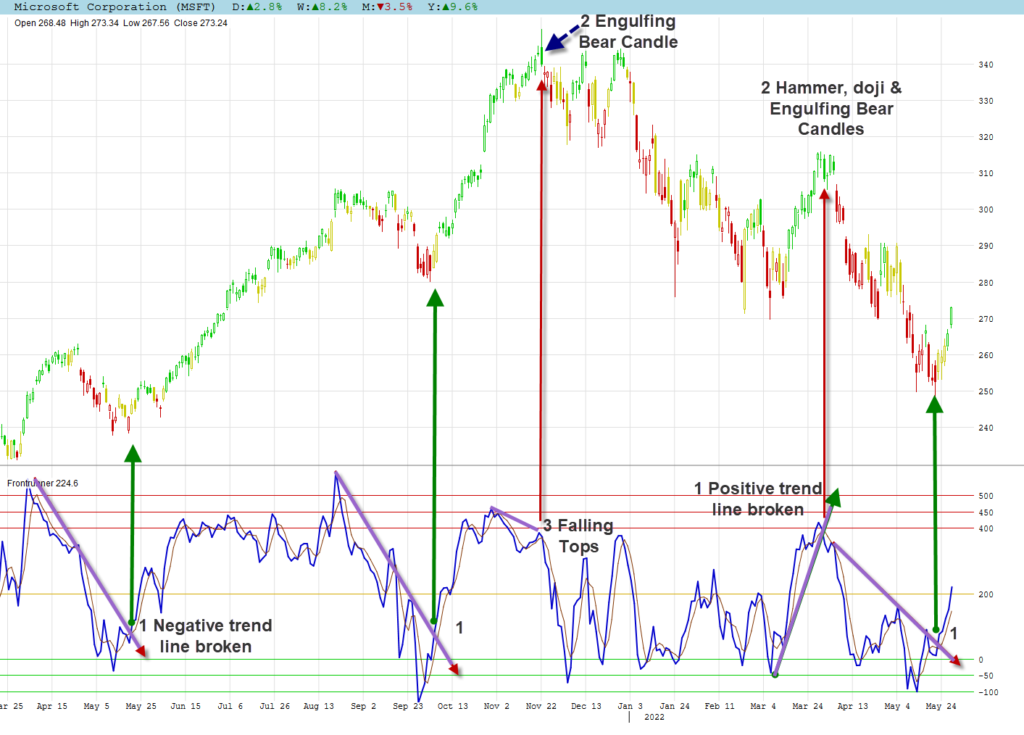
Daily Stock Chart Example
I have marked the chart of Microsoft Corporation with green arrows for positive signals and red for negative signals. Trend lines are drawn in purple on the indicator only in this example. The corresponding scenarios mentioned above are numbered on the chart. Too keep the chart uncluttered, all the scenarios are not marked. If you read Lesson 1 you should notice that some of the rising bottoms or falling tops are also divergence signals.
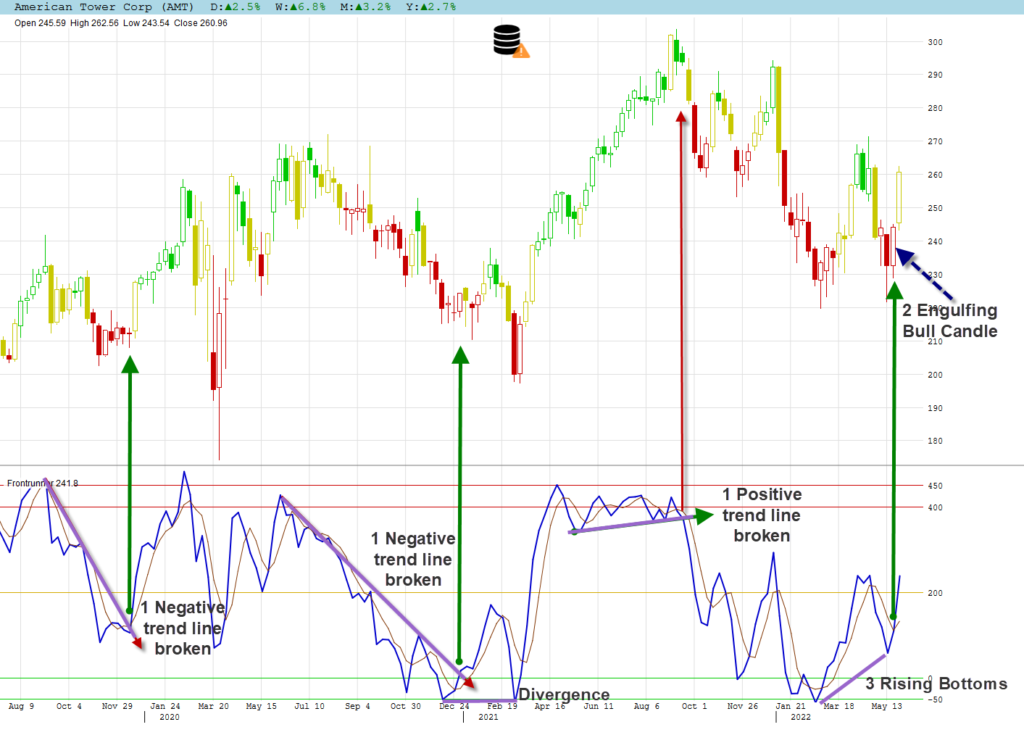
Weekly Stock Chart Example
If you are a long term investor and not bothered with the daily noise, it is best to look at a weekly chart. I marked the mentioned scenarios on the weekly chart of American Tower Corp. One should be careful of reacting too fast, let a signal rather develop fully and see if other signals are also confirming.
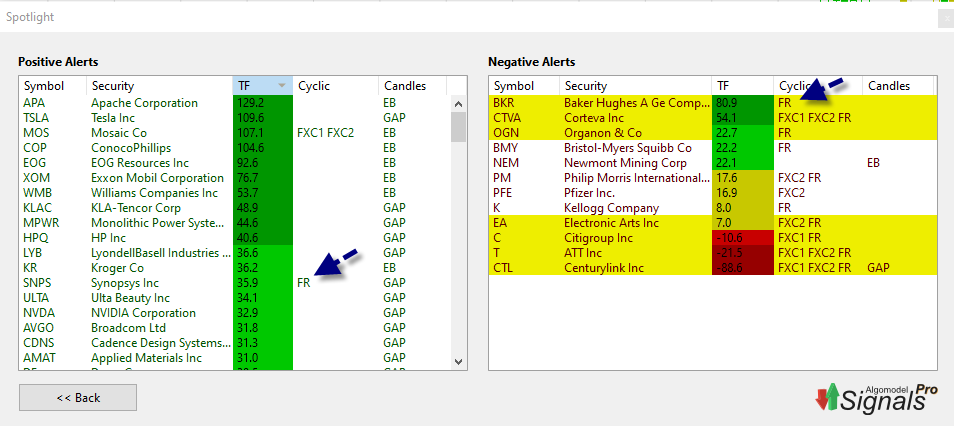
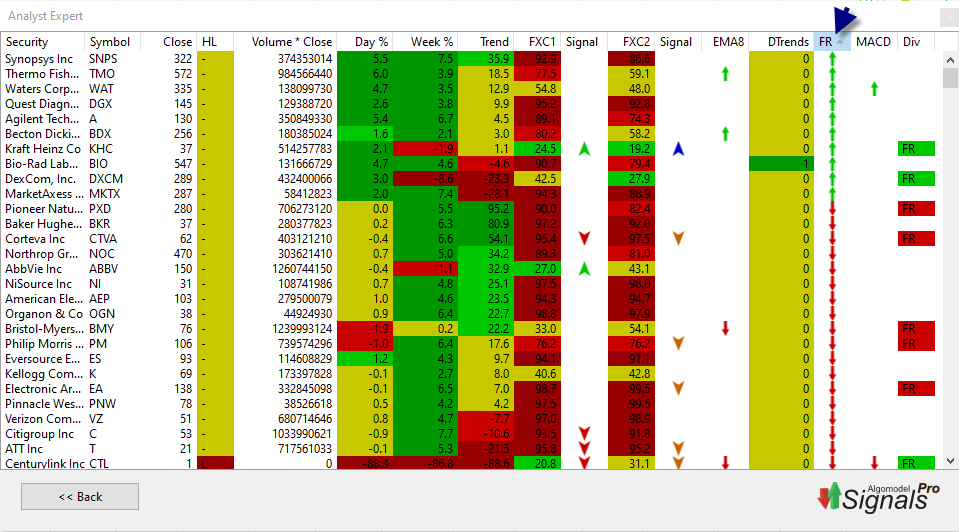
Finding Frontrunner Breaks
You can easily find Frontrunner breaks in Algomodel Signals Pro by running the explorations Spotlight or Analyst expert.
The columns in the explorations can be sorted to group the similar signals together. This was done in the example of the Analyst Expert. By default shares are sorted according to their Trend Factor as in the Spotlight example.