Most candlestick signals are trend reversals. There are however a group of candlestick patterns which are continuation indicators. The continuation pattern reviewed in this education post is GAPS. The Japanese commonly refer to a gap as a window. Whereas the Western expression is “filling the gap”, the Japanese would say “closing the window”.
Definitions
A candlestick is a type of price chart used in technical analysis that displays the high, low, open, and closing prices of a security for a specific period. It originated from Japanese rice merchants and traders to track market prices and daily momentum hundreds of years before becoming popularized in the United States. The wide part of the candlestick is called the real body and tells investors whether the closing price was higher or lower than the opening price.
A window is a gap between the prior and the current session’s price extremes.
Gaps can be caused by many things: Company results (Good or Poor), Acquisitions, Announcements, Market perceptions, etc.
Filling the gap is when later moves close the opening, caused by the gap, in the opposite direction.
Open Windows can also act as resistance or support level for future moves.
GAP TYPES
1 Breakaway Gap: Breakaway Gaps occur at the end of moves, in the opposite direction. They are the easiest to spot as it is usually the first gap in a new direction.
2 Continuation Gap: Continuation Gaps occur at approximately the 50% point of moves, and are more difficult to identify when they happen. But as price moves away in the direction of the gap, it can become apparent that the gap has likely marked the 50% point, giving us a target for the end of the move.
3 Exhaustion Gap: An Exhaustion Gap occurs at the end of a move. If price reverses to move into the zone of the gap (closing the window), you probably have Exhaustion.
Daily Stock Chart Example
You obviously will not always find that all 3 gaps will appear in a sequence. That only happens in an ideal graph that is very rare when dealing with stocks.
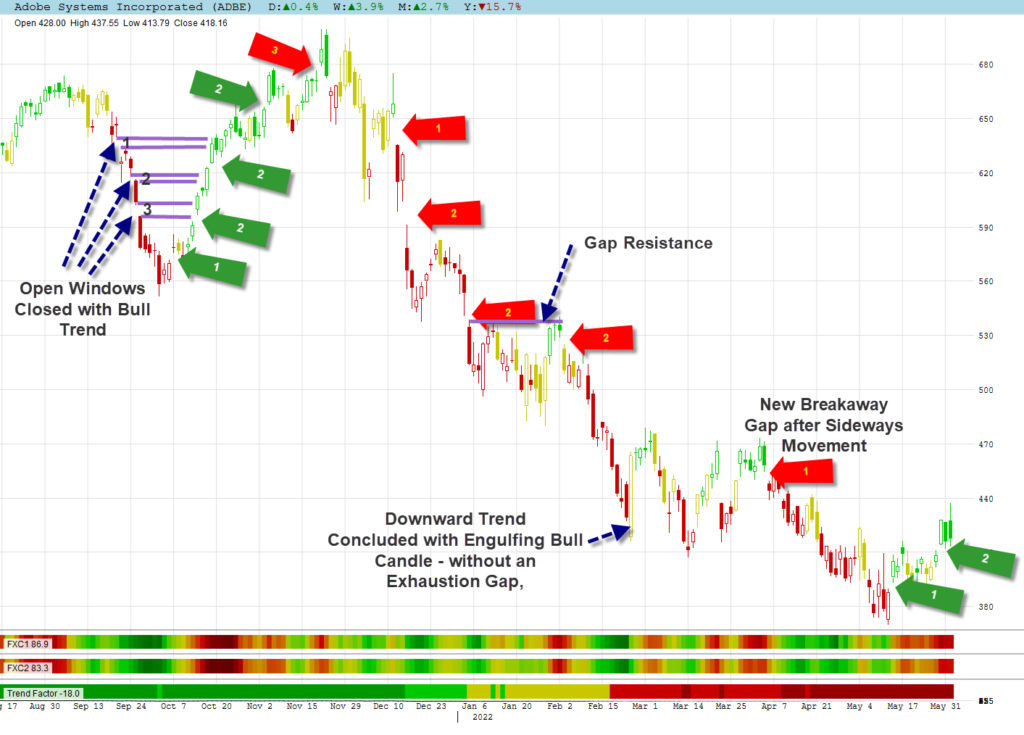
I marked the gaps on the graph of Adobe Systems:
- The first negative trend (red candles) had all 3 gaps with the continuation gap at approximately 50 % of the move.
- The following positive trend (green candles) had 3 continuation gaps after the breakaway gap. All open windows were closed with the positive trend and was concluded with an exhaustion gap and an engulfing bear candle a day later.
- A long negative trend followed that also had 3 continuation gaps. This trend was never concluded with an exhaustion gap, instead it was concluded with a very large engulfing bull candle. The second continuation gap acted as resistance for the negative trend to continue.
- We had a sideways movement for about 3 weeks before a new negative trend started with a breakaway gap. This negative trend had no other gaps and concluded with an inverted hammer and piercing candle.
- The last positive trend is still in progress with a breakaway gap and continuation gap? The last gap is not confirmed and could easily turn out to be an exhaustion gap.
Weekly Stock Chart Example
You would seldom find a gap on a weekly chart as gaps are generated by a daily move and a weekly chart shows 5 days combined.
Finding Gaps
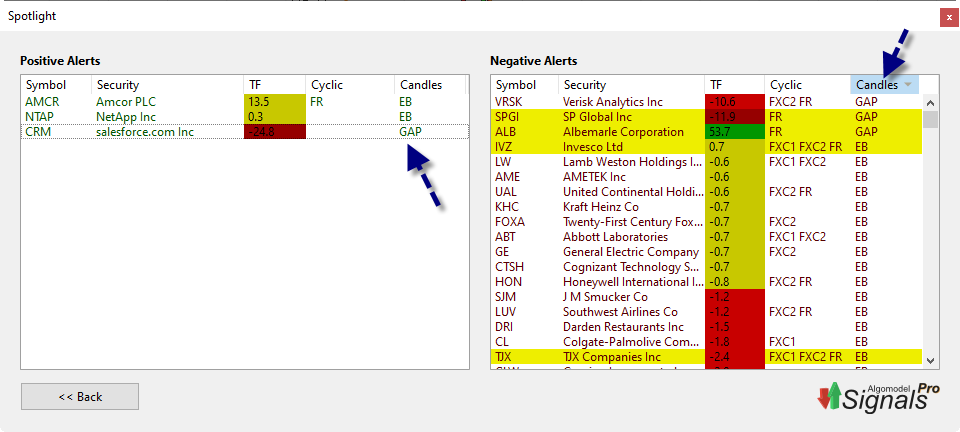
You can easily find gaps in Algomodel Signals Pro by running the exploration Spotlight.
The columns in the explorations can be sorted to group the similar signals together. This was done in the example to bring all the negative alert gaps to the top. By default shares are sorted according to their Trend Factor. There was only one gap amongst the positive alerts, namely salesforce.com.