As they say in the classics: ‘The Trend is your Friend’ and I would like to add: ‘and NEVER invest against the Trend!’ I start with this quote as Algomodel Signals Pro is all about trends.
The concept of candlestick charting was developed by Munehisa Homma, a Japanese rice trader. During his routine trading, Homma discovered that the rice market was influenced by the emotions of traders, while still acknowledging the effect of demand and supply on the price of rice.
A later development on candlestick charting was Heikin-Ashi charts. The Heikin-Ashi charts, developed by Munehisa Homma in the 1700s, share some characteristics with standard candlestick charts but differ based on the values used to create each candle.
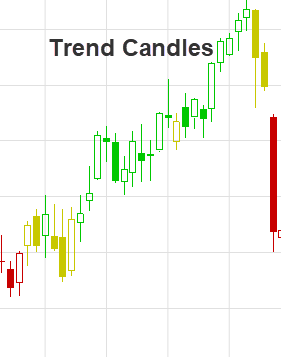
To simplify graphs, we developed Trend Candles that is based on the standard candlestick charts, but color coded to show the current trend.
Trend Candle Colors
Trend candles are classified in 3 colors to identify their trend.
- Green: Positive Trend
- Yellow: Trend change or Indecision
- Dark Red: Negative Trend
Candle Body Colors
- The body of the candle is blank if the closing price is higher than the opening price. (Positive)
- The body of the candle is colored solid if the closing price is lower than the opening price. (Negative)
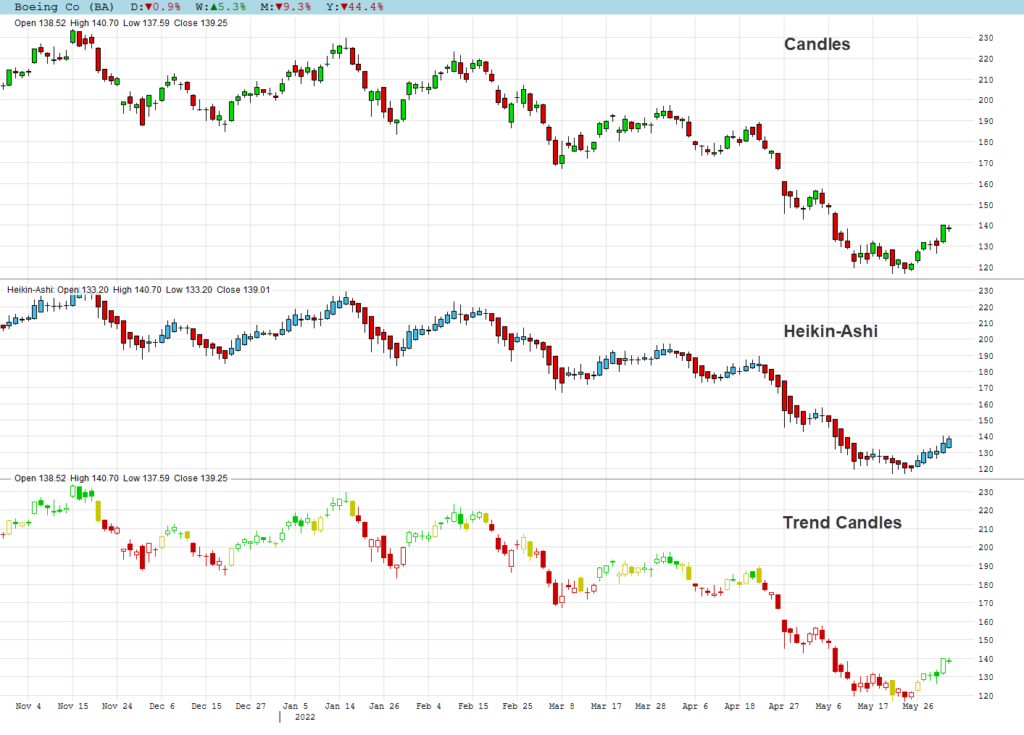
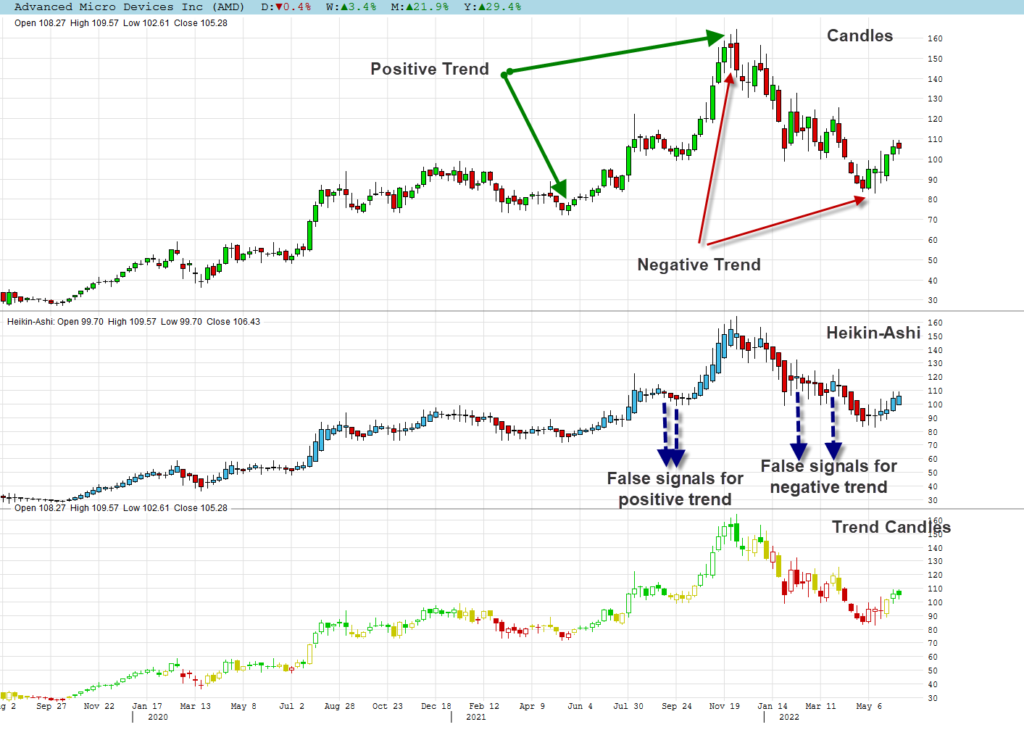
Daily Stock Chart Example
The same chart as shown above is used to make a few observations:
Candle Chart
- In the standard candle chart it is very difficult to see trend changes.
- It is best suited for standard candle formations and signals.
Heikin-Ashi
- The most important item to notice is that the candles of a Heikin-Ashi chart looks completely different to that of standard candles. This comes about because a few days data are used to calculate a new candle. One example is that the leg at the bottom of a normal candle is now a leg to the top with a total different meaning to a normal candle
- Because candle shapes are calculated differently, the standard chart patterns and interpretation are not applicable.
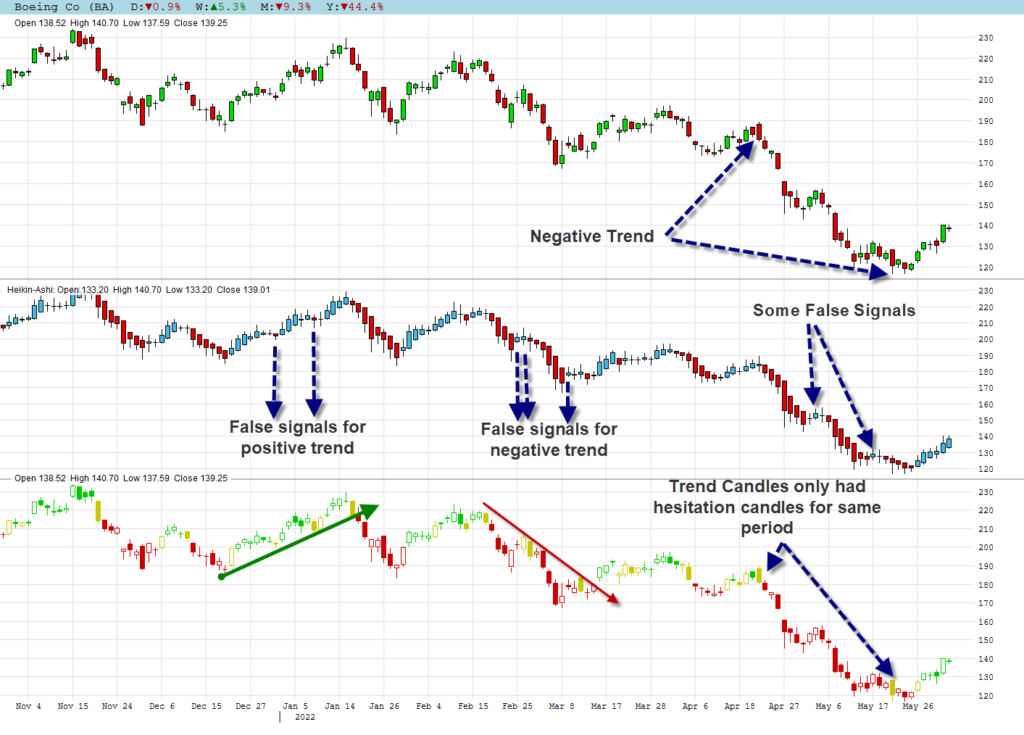
- A better trend formation can be seen on the Heiken-Ashi chart to that of standard candles, but with some false signals.
- The Heiken-Ashi chart is best suited for drawing trend lines that will be shown in the lesson about trend lines.
Trend Candles
- Candle shapes are the same as standard candles and only the colors are different.
- Standard candle formations and signal interpretation are the same.
- Trend Candles add trend color to the standard candle chart.
- Trend Candles show the false signals mostly as hesitation candles.
Weekly Stock Chart Example
The same comments as for the daily chart are applicable for a weekly chart. A weekly chart of Advance Micro Devices is shown.
Trend Candles Template
Trend Candles can be added as an additional chart in Algomodel Signals Pro or a standard Template can be used to view the trend Candles.
Algomodel Signals
Template
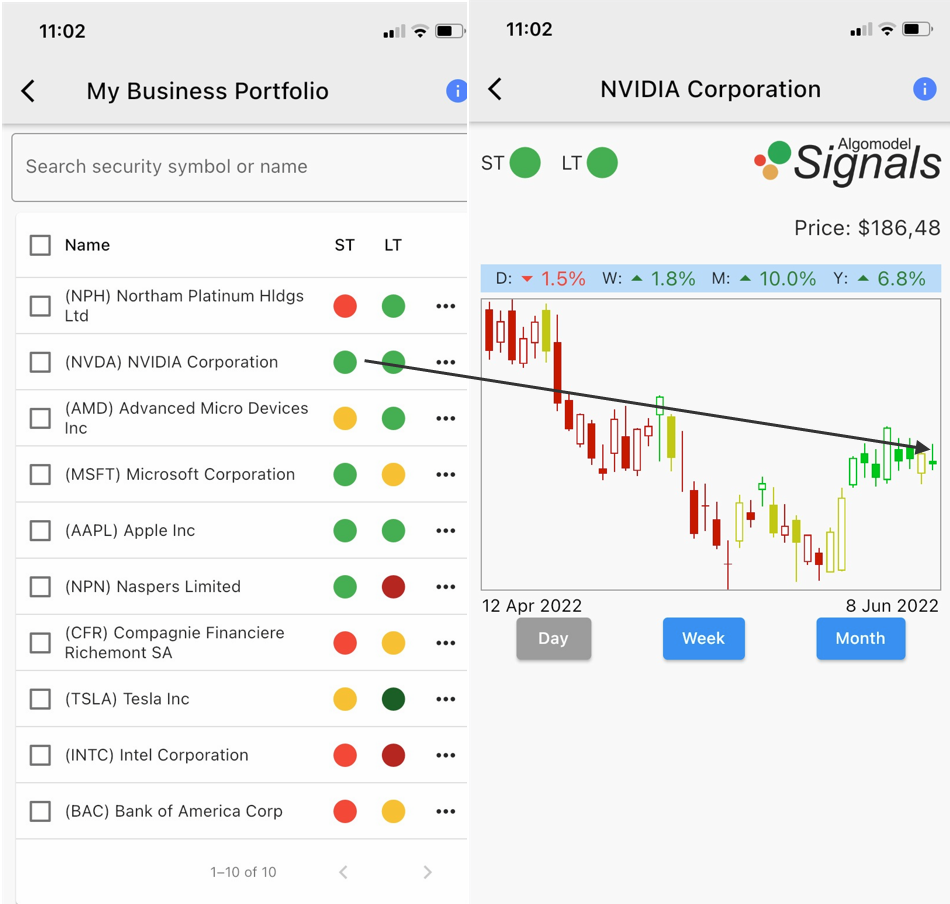
All graphs shown in Algomodel Signals (mobile phone or tablet) are shown with a Trend Candle Template.
Signals
Short term signals (ST) and Long term signals (LT) are shown on portfolio lists and corresponding graph. This helps to track the performance of your selected portfolio.
Short term signals are shown as the Trend Candle Color.
Long term signals are showing the Trend Factor color.