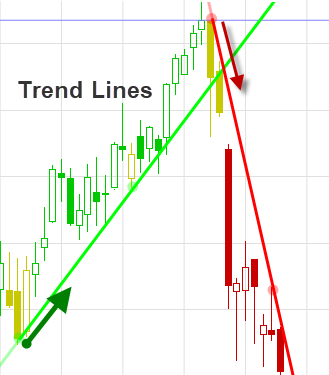
As Trend Lines is all about staying with a trend, I must stress again that ‘The Trend is your Friend’.
In Algomodel Signals Pro we have 3 indicators to help you stay with a trend:
- Trend Factor: To be used for selection of shares that have a good trend history. (Lesson 4)
- Trend Candles: Shows the current trend of shares with a color template. (Lesson 5)
- Trend Lines: To help with decisions on when a trend is changing and as a confirming indicator for cyclic signals.
If you only had to choose one technical indicator to use, my choice would be Trend Lines.
Buy and Hold verses following the Trend
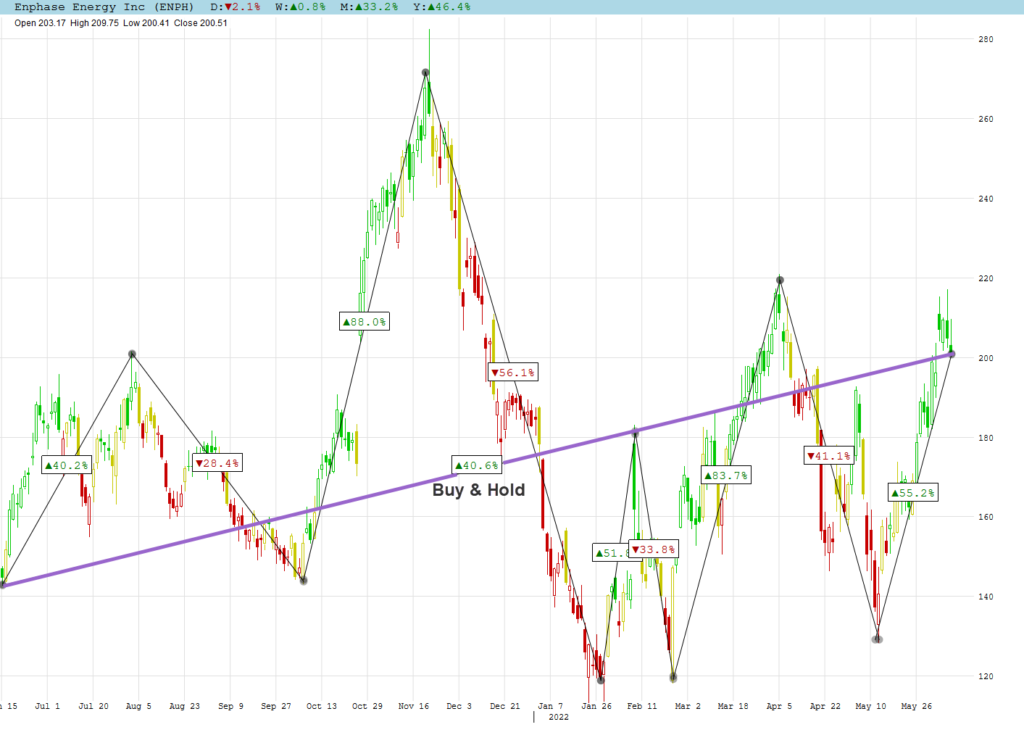
Before we get started on Trend Lines, I need to show why trend is so important. For my example I chose Enphase Energy Inc that has the best Trend Factor in the S&P 500 at the time of writing this lesson. I chose a strong trend factor share for the buy and hold option to show a positive profit.
I start the example on 15 June 2021. On the chart you can see the cyclic % moves if you have the ability to catch all the tops and bottoms. (About impossible to achieve) The cyclic total moves outperforms the buy and hold option substantially!
Performance of Enphase Energy:
- Buy and Hold: +40.6%
- Long Only: +318.9%
- Long & Short: +478.3%
Trend Line Types
In Algomodel Signals Pro we included two types of trend lines:
- Diagonal trend lines
- Horizontal trend lines, also referred to as support or resistance lines
Drawing Trend Lines on Charts
To use Trend Lines, the user must unfortunately also do some work. Drawing trend lines is hard work and requires practice to develop good skill. The old PC program usage principle still applies: ‘Garbage in …. Garbage out’. BUT who said that trading shares were easy?
My suggestion would be to start with a small selection of shares. Trend Factor can help you with a good selection and then add them into a watchlist. Now you are able to watch them regularly and adjust your lines if necessary.
For a positive trend line the diagonal trend line must touch the bottom of the trend candles and for a negative trend line the top. If you position the line too close to the share prices, it might give a break signal too soon and does not give the chart some breathing space for small corrections or J-curves to form. The more points the line touches, the stronger and more accurate it will be.
Horizontal trend lines forms when a share moves sideways. When resistance is broken a new trend has been established.
Trend lines can be drawn in different colors and thicknesses. This is very useful if you want to distinguish between trend periods, ultimate extreme prices or target prices. The horizontal trend line price is highlighted with the same color as the line as shown in the daily stock chart example.
Trend lines can clutter a graph terribly and for that reason I try and keep only the most recent lines. You can also toggle between making them visible and invisible by right clicking on the chart and choosing the option.
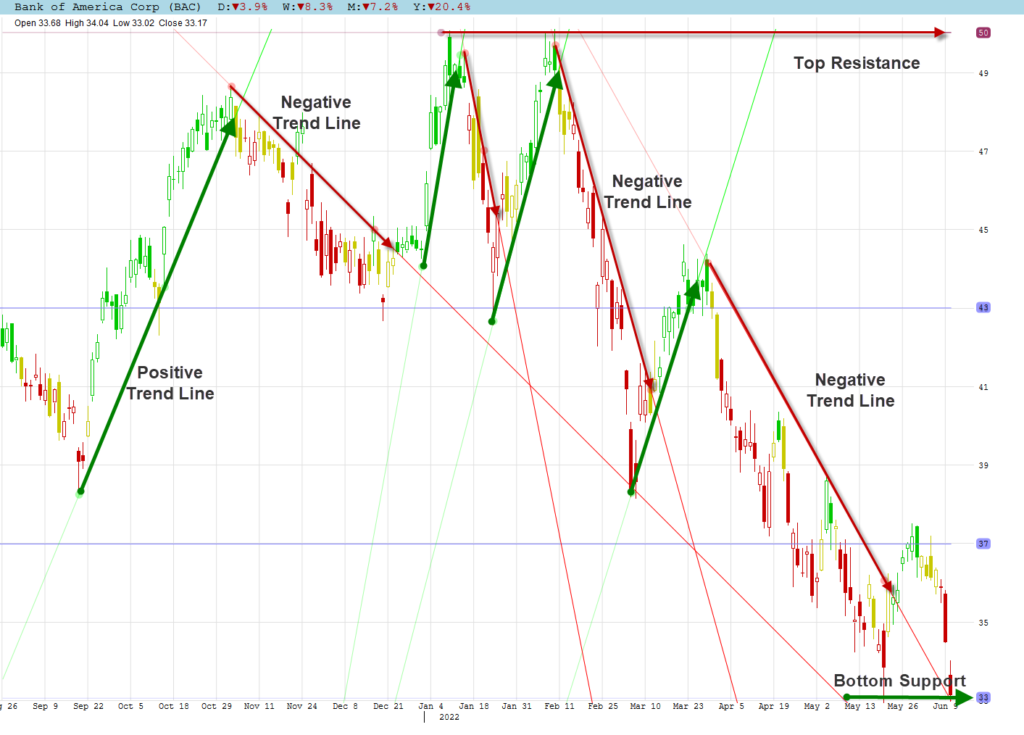
Daily Stock Chart Example
Some trendlines are drawn on the chart of Bank of America. The diagonal trend lines are highlighted up to the point where they were broken.
The top resistance and bottom support lines are horizontal trend lines.
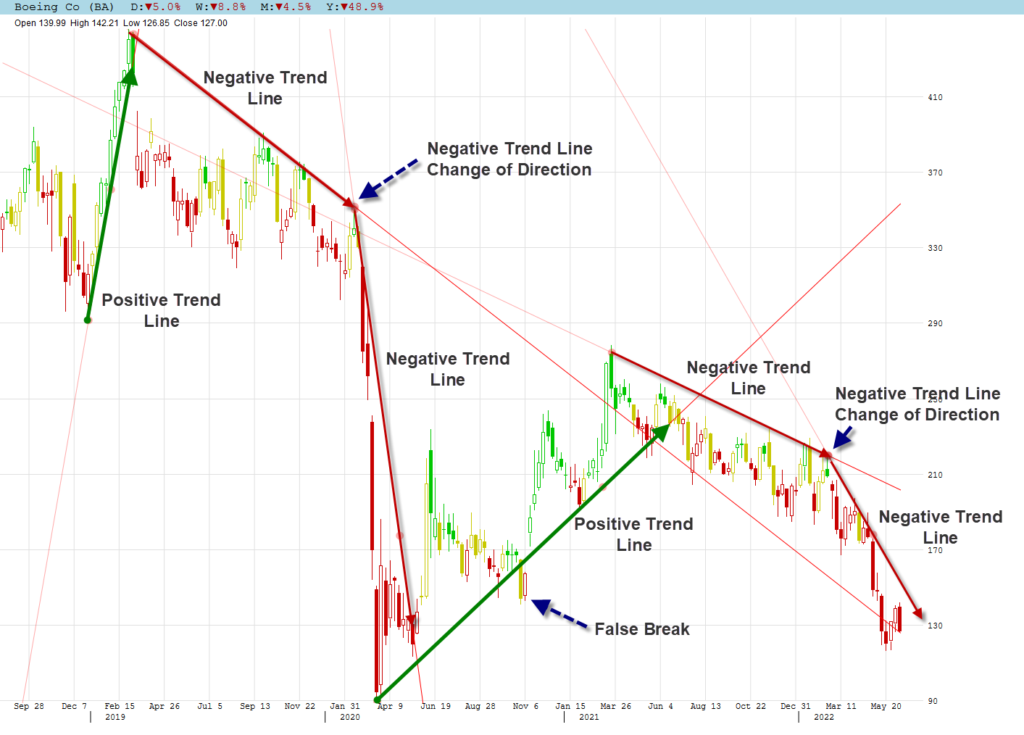
Weekly Stock Chart Example
Additional observation on the weekly chart of Boeing Co:
- At two negative trends we had the trend lines changing direction to fall even steeper. I sometimes refer to is as moving into second gear.
- On 6 November 2020 we had a false break of the positive trend line shown. False breaks are very annoying and forms part of the market’s many ways to confuse you. If a share price cannot stay 4 days above or below a trend line after breaking it, we refer to it as a false break.
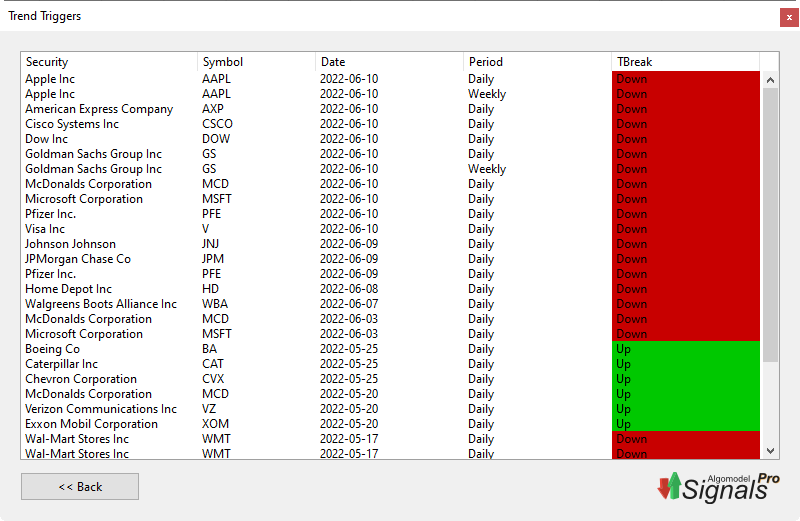
Trend Triggers Exploration
An exploration called Trend Triggers is included in Algomodel Signals Pro to find shares that has broken a trend line.
The exploration summary show all drawn trend lines that are broken on daily and weekly charts. You are able to click on any line to open its chart to view what trend line was broken.
Trend Line Uses
Trend lines can be used as a system on its own or as confirmation for cyclic systems. Both of these uses will be discussed in the systems lessons.