
Any System to use in the stock market should preferably comply with the KISS principle: “Keep It Simple Stupid”.
If one makes it too complicated by using many indicators, you will get many conflicting signals and then you do not know whether you are coming or going.
Technical analysis helps guide traders to what is most likely to happen, and is about making predictions and decisions based on probability, not guarantees. Fundamental analysis is useful for long-term investing. Since both technical and fundamental analysis are useful, most brokerages employ both types of analysts.
An analyst once said: “With no system, you are dead in the market”. If something works more often than not, even though it doesn’t work all the time, it can still be very effective at gaining profits.
The market is designed to outwit you and you must use everything to your disposal to come out on top.
Cyclic Signals included in Algomodel Signals Pro
Cyclic Signals, like most technical signals, must be used as a possible alert for change in trend. These signals must be confirmed to make them more reliable.
Signals shown with arrows on graphs:
- FXC1: This indicator is made up of 6 indicators and then grouped together, color coded and then shown as a signal or heatmap.
- FXC2: This indicator is made up of 4 indicators and then grouped together, color coded and then shown as a signal or heatmap.
- Power Signals: Frontrunner must break its moving average in an extreme oversold or overbought territory.
Signals shown as graphs:
- Frontrunner: A proprietary signal of Algomodel Signals Pro shown as an indicator graph.
- MACD: This signal is a standard indicator that can be found in any software. We color coded the bars of the MACD for our usage.
Confirmation of Signals
While a strong trend is in place, you may get many false alerts to draw you into the market too early, or make you get out too soon. For this reason confirmation is important to keep you in the trend. All cyclic signals tend to be more accurate in a sideways movement.
- MACD Bars change color
- Frontrunner moving average break
- Trend line Break
- Heatmaps (FXC1 or FXC2)
- Price movement
- Candle formations
Probable Sequence of Turn
- You will most probably get a candle turning formation as a first warning.
- One or all of the signals may be activated.
- The MACD bars changed color.
- A trend line break could be final confirmation.
Important Notes
- FXC1 and FXC2 are volatile short term signals that is better used as a heatmap. In Spotlight you will sometimes notice that all the signals can simultaneously give alerts.
- If you are a medium term investor, your trendlines must be drawn in such a way to give a chart breathing space to form J-Curves or short term corrections. This is especially important when a share is in a strong trend, up or down.
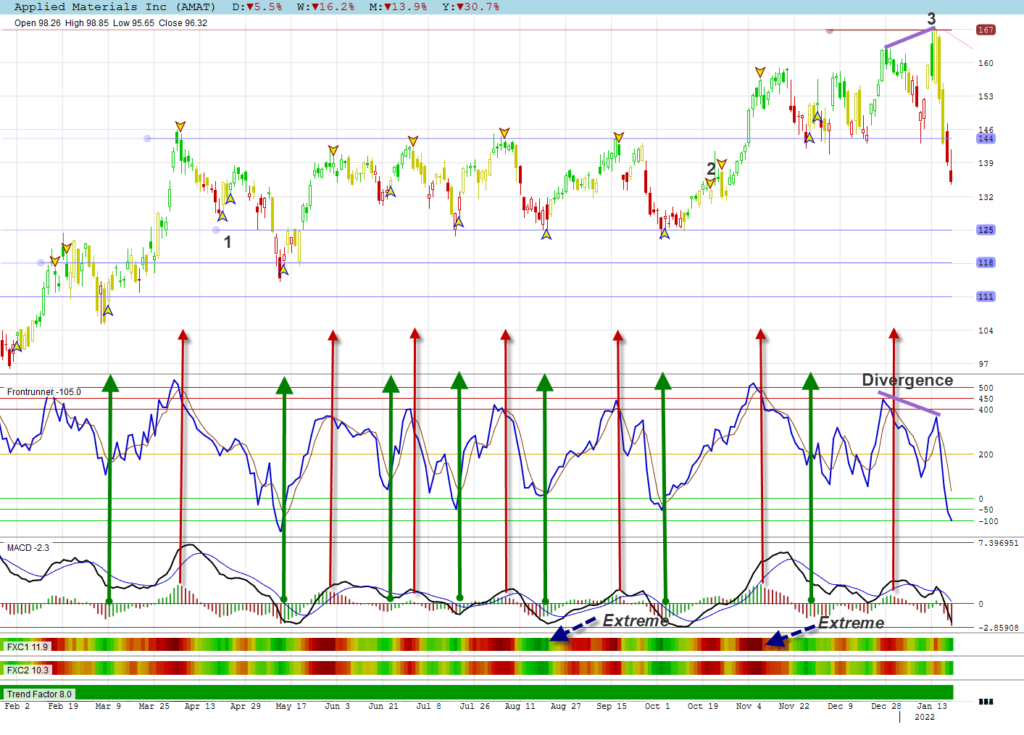
Daily Stock Chart Sideways Movement Example
During a sideways movements one usually get accurate signals with very few false signals. In the following example I used Power Signals as a signal and the following confirmation signals:
- MACD color change.
- FXC1 & FXC2 heatmaps as confirmation
- No trendlines as we have a sideways movement
All the Buy Signals marked (green) was confirmed with a MACD changing color in oversold territory according to the heatmaps.
All the Sell Signals marked (red) was confirmed with a MACD changing color in overbought territory according to the heatmaps.
I did not mention the Frontrunner breaks as it is already included in the Power Signals (yellow arrows) as the main signal.
At the positions marked 1 & 2 we had false signals, but they did not occur at a support or resistance line.
At position 3 we had no sell signal, except that divergence was the key here. When a share is making new highs or lows, always check for divergence!
Daily Stock Chart Trend Example
When a share goes into a bull trend one can get many false sell signals and for that reason a trend line and confirmation becomes very important. You also might not get any later buy signals during a bull trend as the indicators turn at much higher positions during a small correction and do not drop enough to activate the signal. For example, the standard RSI signal has a trigger value of 30 to buy, but in a bull market that value usually turns between 40 and 50 and you will never get a trigger. This will be discussed in another lesson. It is therefore important to use other methods to keep you in a trend.
I show CenterPoint Energy Inc for discussion of the 15 positions marked:
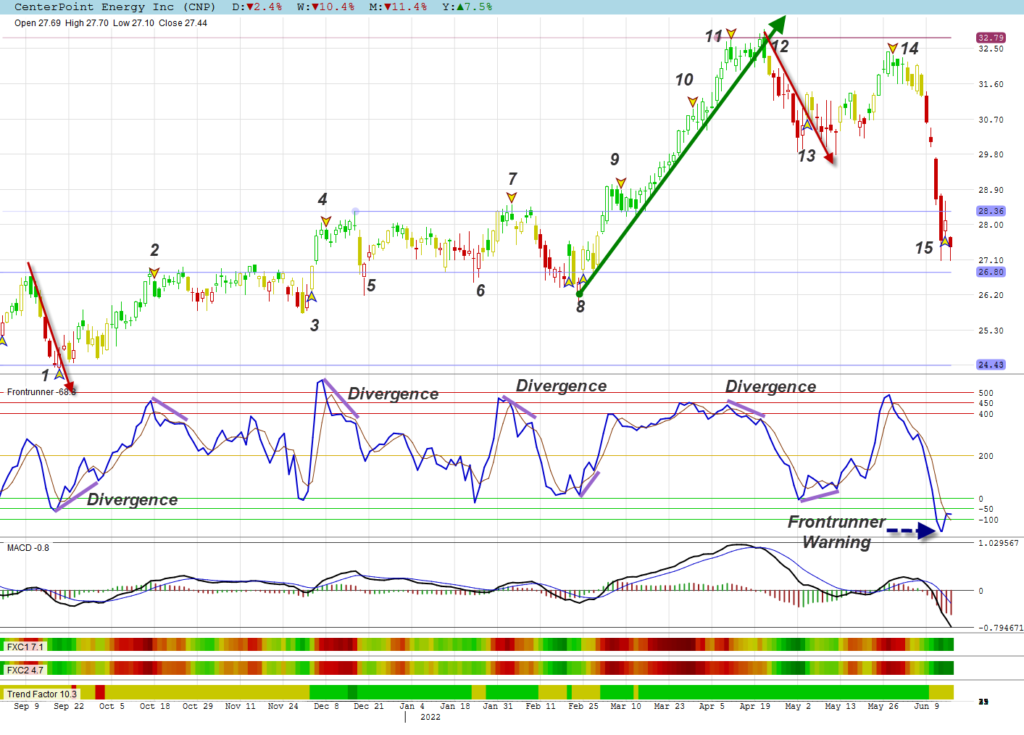
- 1. After an inverted hammer candle a power signal was given with an engulfing bull candle. The negative trend line was broken the following day as confirmation. Eight volatile days followed, but divergence confirmed confirmed the signal.
- 2. At resistance, the price ran out of steam and a power sell signal was given. This signal was also confirmed with divergence 6 days later. The share actually did not correct much, but rather moved sideways for 3 weeks.
- 3. The resistance line that formed was broken with a bullish candle, MACD color change and a power signal.
- 4. At this position a power sell signal was given while the trend candles remained green. A J-Curve actually formed and 6 days after the signal a doji candle and divergence confirmed the signal.
- 5. The correction was actually small and only took the price back to the previous resistance line that was now support.
- 6. The sideways movement that followed tested the support again at 6. Here we had a Rickshaw Man candle (long leg) and an engulfing bull candle. The position was not oversold enough to give a power buy signal and only the candle formation was a trigger. Frontrunner did break up and broke its own trend resistance. Trend resistance breaks will be discussed in next lesson.
- 7. A power signal was triggered with MACD changing color. This signal was conformed with divergence 4 days later.
- 8. It corrected back to the support line and and two power buy signals were given. It was confirmed with a very bullish candle and a breakaway gap.
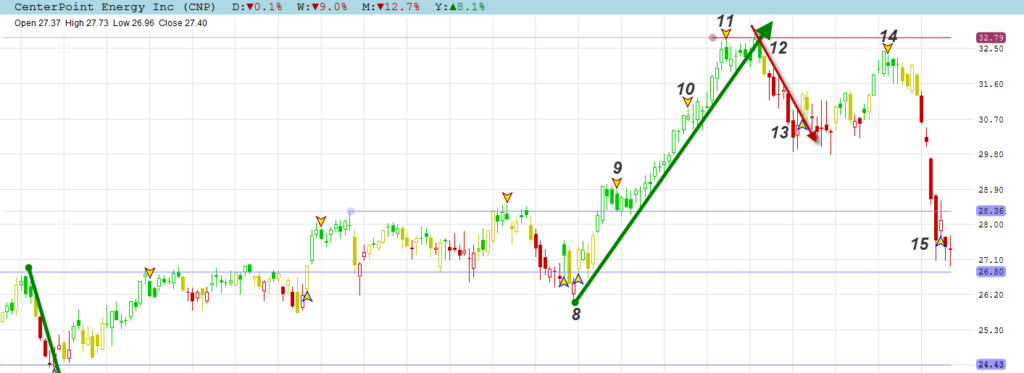
- 9. A strong trend followed and the previous resistance was broken. Profit taking stepped in and a J-curve formed. The J-curve never dropped below the new support line and the trend candles remained green to keep you in the market with a false alert.
- 10. The bull trend continued and a well defined bull trend line was now in place. We had another false signal at 10 with profit taking, but the trend candles remained green and the trend line was not broken, thus no confirmation.
- 11. A power sell signal was given, but with green trend candles and the strong trend line not threatened.
- 12. A large engulfing bear candle developed that broke the positive bull trend line. Divergence was in place between 11 and 12. Divergence and the break of such a strong trend line were confirmation of the power sell signal at 11.
- 13. Trend candles turned red and a short term negative trend line developed. A bullish candle broke this trend line with a power buy signal. The buy was not confirmed as the price movement of the next day was negative. The price dropped back to the break line, but this time we had divergence to actually confirm the buy.
- 14. The price advanced until we got a power sell signal. The Hammer and Rickshaw Man candles that followed gave more confirmation alerts together with trend candles and MACD changing color.
- 15. A steep correction followed with a false signal at 15. When Frontrunner drops below -100 it actually warns that more lows are coming. (Will be discussed in another lesson) The next day’s price movement also did not confirm this signal. Another low with divergence usually follows to give a true turn.
Weekly Stock Chart Trend Example
Keep in mind that each bar on a weekly chart is actually 1 week’s data. I only showed the long term trend lines on the chart to avoid too much clutter.
For the weekly chart example I will discuss the chart of Fluor Corporation that shows 3½ years:
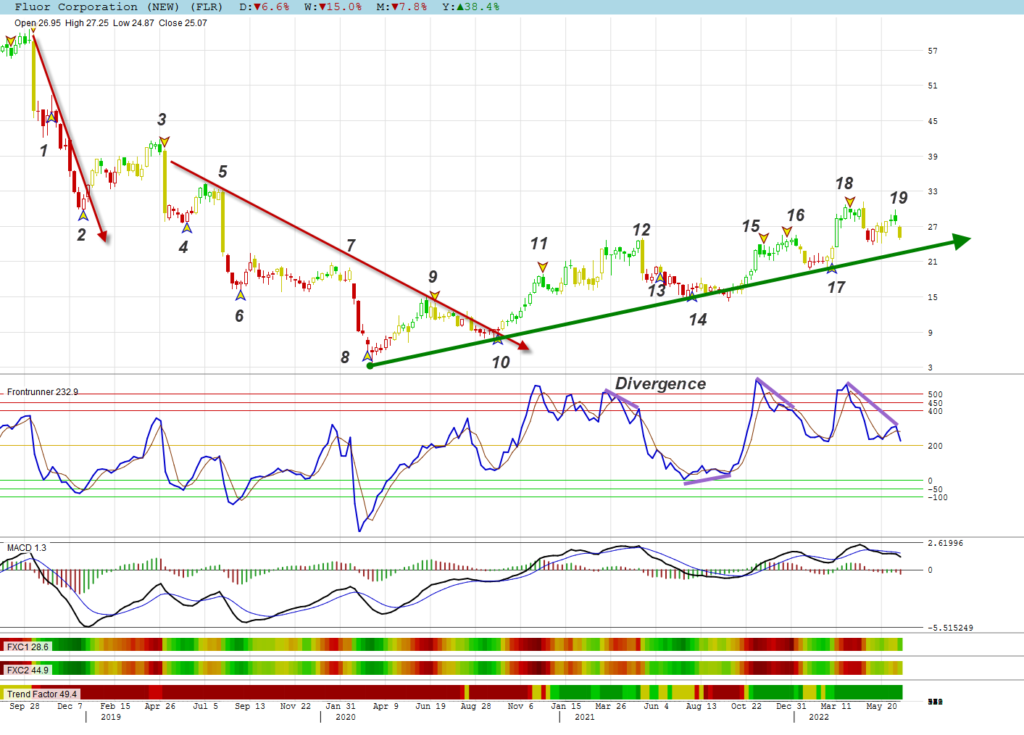
- At positions 2, 3, 4, 5, 6, 8, 9, 10, 17 and 18 we had short term trend line breaks with the MACD changing color.
- False signal 1 did not break the trend line, nor did the next bar’s movement confirm direction.
- At 7, 12 and 19 we had no power signals as the heatmaps were not in extreme territory, but the price did break down and we had divergence in place.
- The long term negative trend line was broken at position 10 and a new long term bull trend was now in place.
- 11 Gave an Engulfing bear candle, but it only formed a J-curve and none of the candles turned red. The bull trend continued to position 12.
- At 13 an inverted J-curve formed with the candles not confirming with a change in color to green.
- A true signal was given at 14 and only confirmed with divergence 8 days later.
- The signal at 15 was only confirmed at another signal at 16 with divergence.
- At 19 we had no signal, but divergence to confirm the abc correction that was in progress.
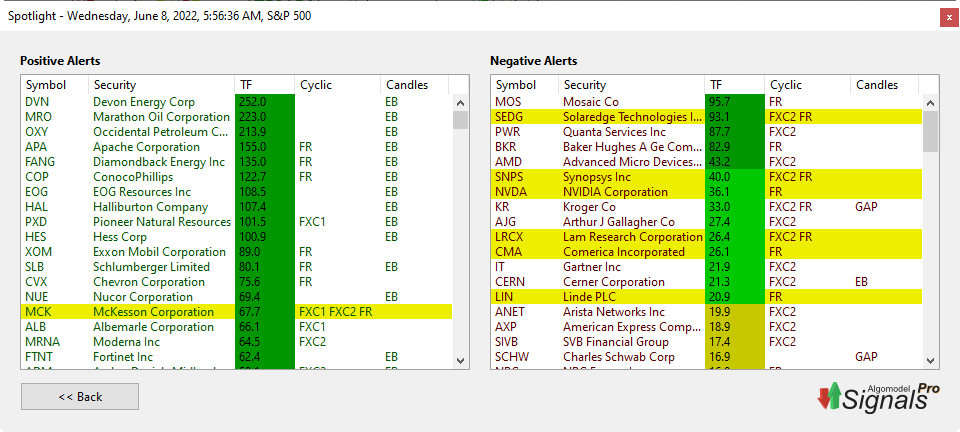
Signals in Spotlight Exploration
An exploration called Spotlight is included in Algomodel Signals Pro to find daily positive or negative alert signals.
The Signals are split into 2 columns to differentiate between cyclic and candle signals.
Cyclic Signals:
- FXC1: Heatmap change of direction. Shown with arrow on chart if selected under signals.
- FXC2: Heatmap change of direction. Shown with arrow on chart if selected under signals.
- FR: Frontrunner moving average break. Can be observed on Frontrunner indicator chart.
- Power Signal: Frontrunner break in extreme overbought or oversold territory highlighted in yellow. Shown with arrow on chart if selected under signals.
Candle Signals:
- EB: Engulfing Bull candle as positive alert or Engulfing Bear candle as negative alert.
- GAPS: For positive alerts the Low > High of previous day. For negative alerts the High < Low of previous day.
Thanks Derek. It is a lot of information to take in but makes sence with you indicators and examples. Found this info very valuable.
Have a nice day.
Edie
Thanks Edie.
I was wondering if I made too complicated.