Frontrunner has many uses and in this lesson we will discuss another two of them that was only briefly mentioned in the previous lessons.
Frontrunner is a proprietary technical signal of Algomodel and is only available in Algomodel Signals Pro.
Frontrunner Bottom Prediction
The cyclic indicator Frontrunner usually turns at bottom levels between a value of 0 to -100. (3 green lines) During a strong decline you might get the odd occasion where it will dip well below the -100 value. This is then a prediction that a true bottom has not been reached. The price begins an upward trend only to start declining again soon. The next bottom is then given with divergence to signal the true bottom.
Frontrunner Top Prediction
The cyclic indicator Frontrunner usually turns at top levels between a value of 400 to 500. (3 red lines) During a strong trend you might get the odd occasion where it will turn well above the 500 value. This is then a prediction that a true top has not been reached. The price begins a correction only to start advancing again soon. The next top is then given with divergence to signal the true top.
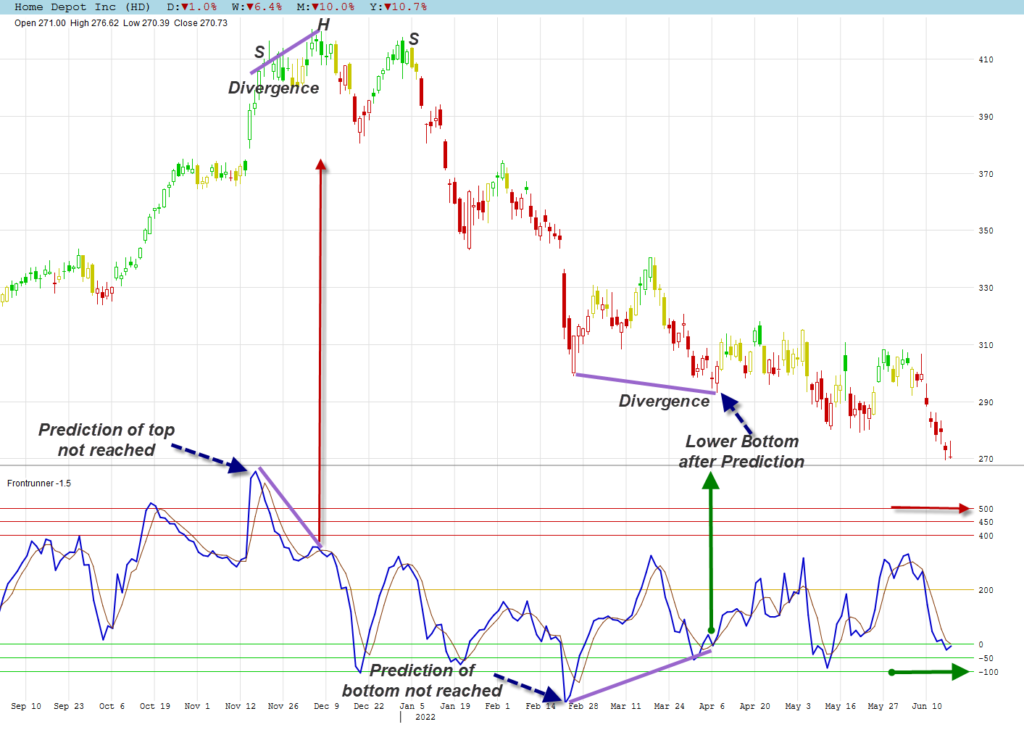
Daily Stock Chart Prediction Example
Home Depot broke the 500 level upwards during November 2021 to make a prediction that top is not reached. Some profit taking made the price move sideways while Frontrunner dropped substantially. When a new high was made early December 2021, divergence was confirming the true top. It also turned out to be the head of a head and shoulder formation.
Steep declines followed and at the end of February 2022 we had a prediction that the bottom has not been reached when Frontrunner dipped well below the -100 value. Short term rallies followed to take the share to a gap that acted as resistance and then the decline followed. A new bottom was made with divergence in place. This is a rare example where a new rally did not start, but rather a sideways movement with further corrections later. Nevertheless, the prediction was correct that new lows were coming.
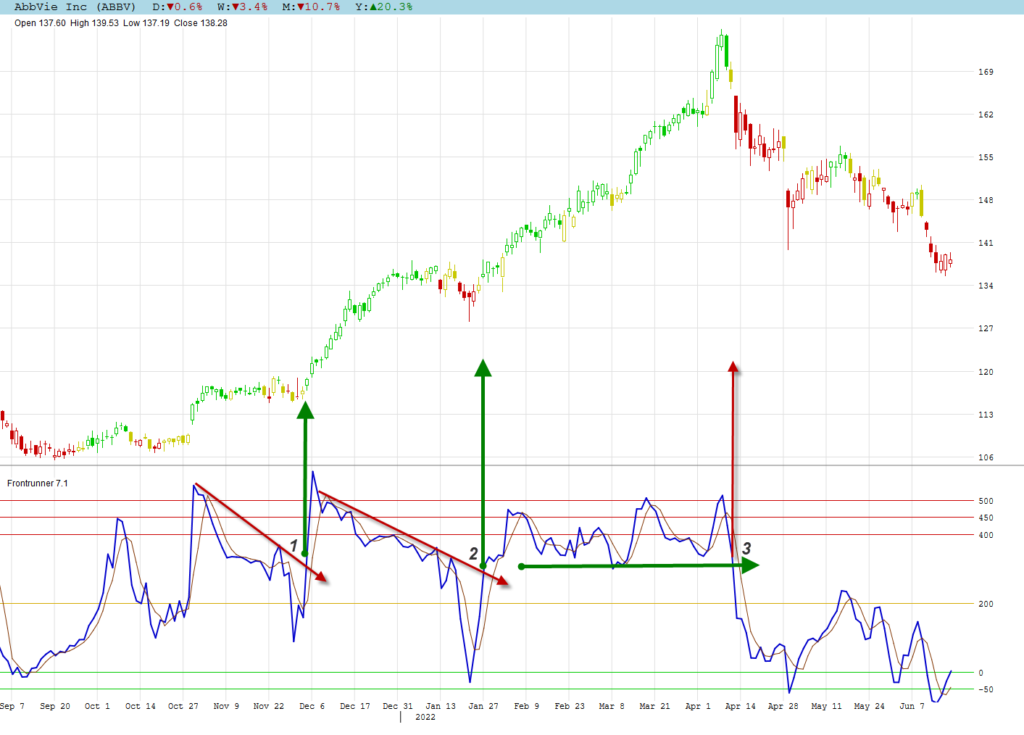
Frontrunner Trend Break
Instead of looking at trend lines on the price chart, it can be very handy to look at it on the indicator. During strong trends and sideways movements you can get numerous breaks of the Frontrunner’s average line. It is then best to wait for the indicator to break its trend line for a true signal.
Daily Stock Chart Example of Trend on Indicator
AbbVie Inc had a strong bullish trend starting September 2021 that lasted until April 2022 with some sideways movements during that period. At positions 1 and 2 Frontrunner broke its negative trend line to confirm continuation of the bull trend.
During the following bull trend, the trend candles never turned red while Frontrunner made numerous false breaks of its average line. A support line below the indicator was broken at position 3 to give an alert that the bull trend was over. This was also confirmed with an engulfing bear candle, breakaway gap and trend candles turning red.