
Bloomberg:
- China electric-vehicle stocks are all the rage, trouncing Tesla
- Stocks roar back with best week in a month
MarketWatch:
- Stock-market returns will be minus 3.3% a year for a decade, says ‘single greatest predicter’
- You’ll know the bear market is nearing an end when anxious investors push the ‘panic’ button
yahoo! finance:
- Nike set to report fourth-quarter earnings on Monday
- Russia to default for first time in a century as payment deadline looms
Global stock markets made a strong positive move on Friday.
Global Indexes
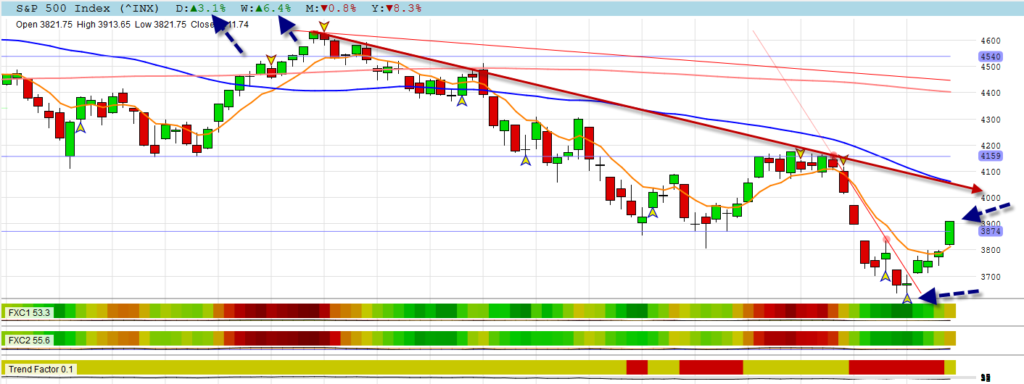
S&P 500
The S&P 500 broke its EMA8 line in style with a strong bullish candle. Notice where the Power Signal warning was given.
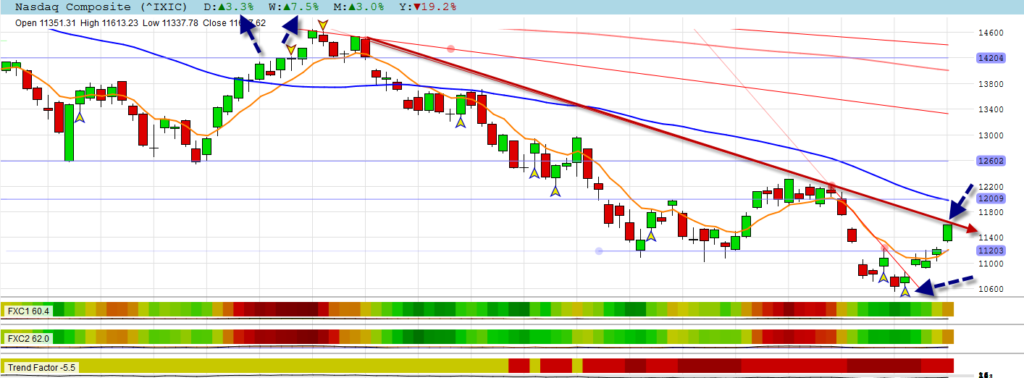
NASDAQ
The NASDAQ closed just below its medium term negative trend line after breaking its EMA8 line already on Thursday.
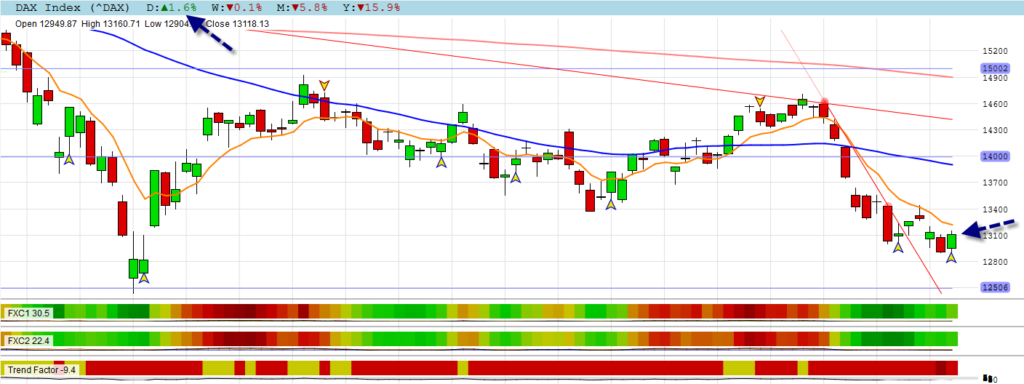
DAX
The DAX still closed below its EMA8 line, but also with a strong positive move.
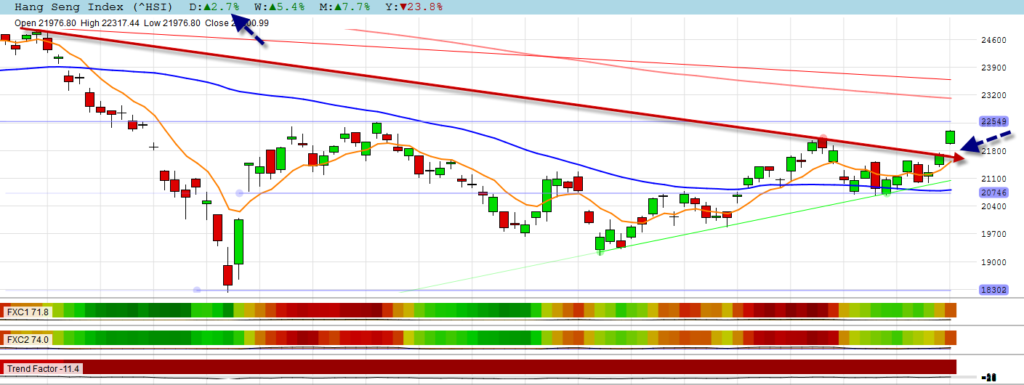
HANG SENG
The HANG SENG closed on its negative trend line on Friday, still inside the wedge, but this morning it broke both the trend line and the wedge to the top with a gap. All the markets are moving positively.
NYSE & NASDAQ Stocks
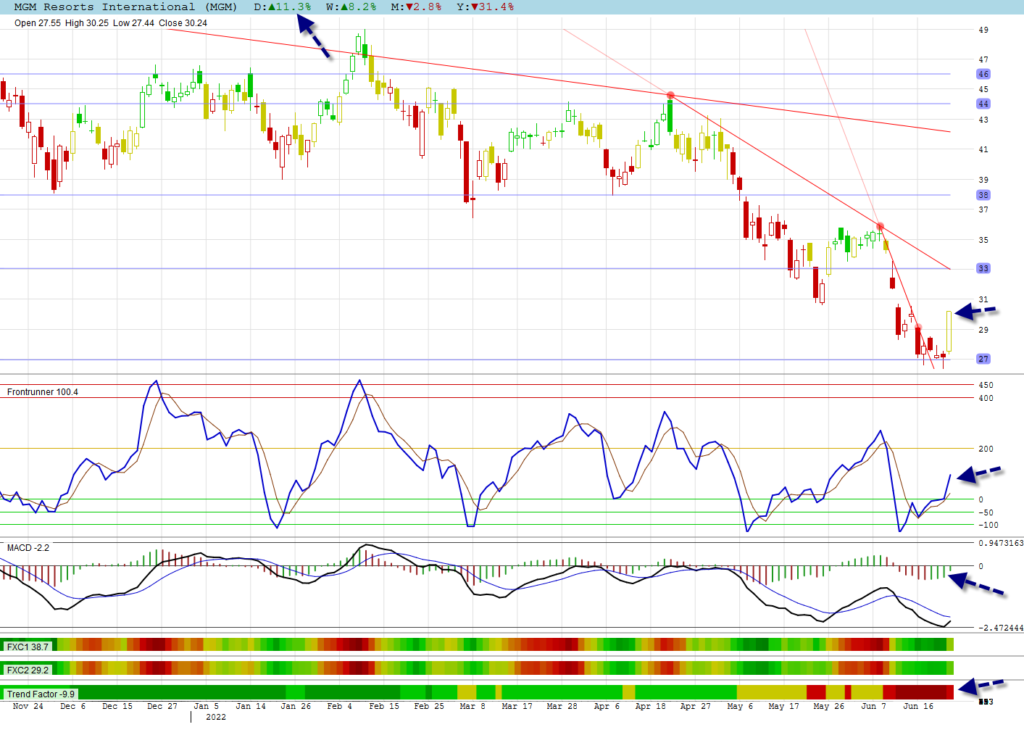
MGM Resorts International
It was the resorts and entertainment shares that bounced the most on the U.S. markets. MGM Resorts International bounced 11.3%. These shares were very oversold and thus the biggest bounce.
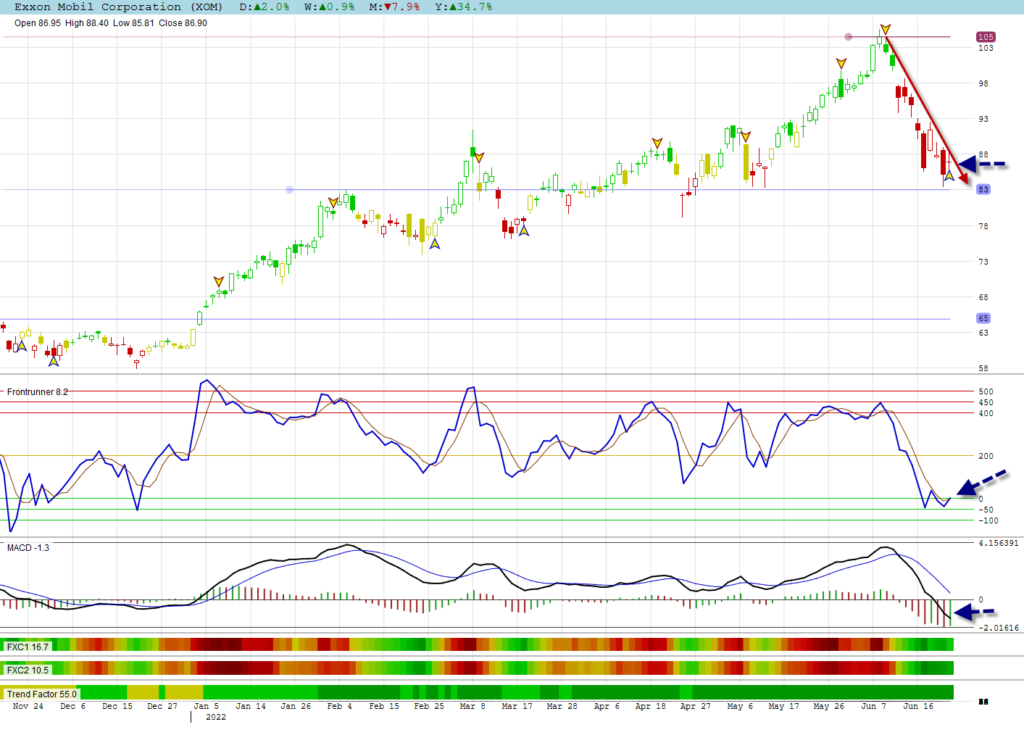
Exxon Mobil Corporation
Instead of just showing the strong moves, lets show a new signal. Exxon Mobil Corporation gave a Harami Cross candlestick signal together with a Power Signal in oversold territory. These are strong reversal signals.
JSE Stocks
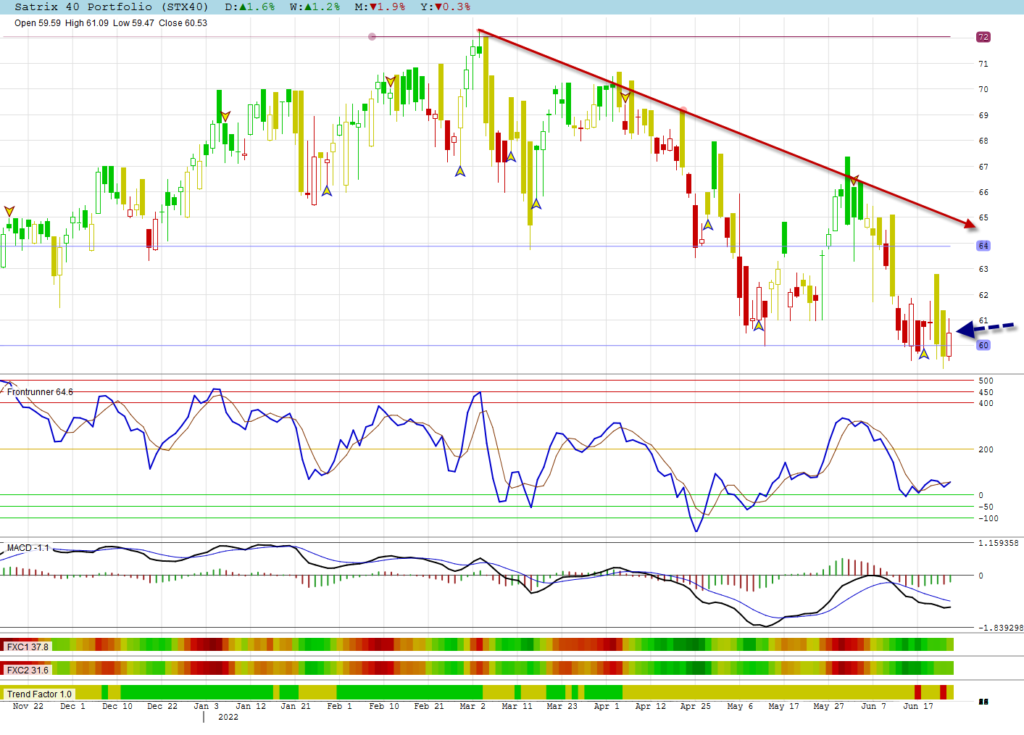
Satrix 40 Portfolio
The volatility for the Satrix 40 Portfolio continued at the 60 level. This time it bounced again. Eight candles around this level so far. This index did not have time to react to the US moves yet.
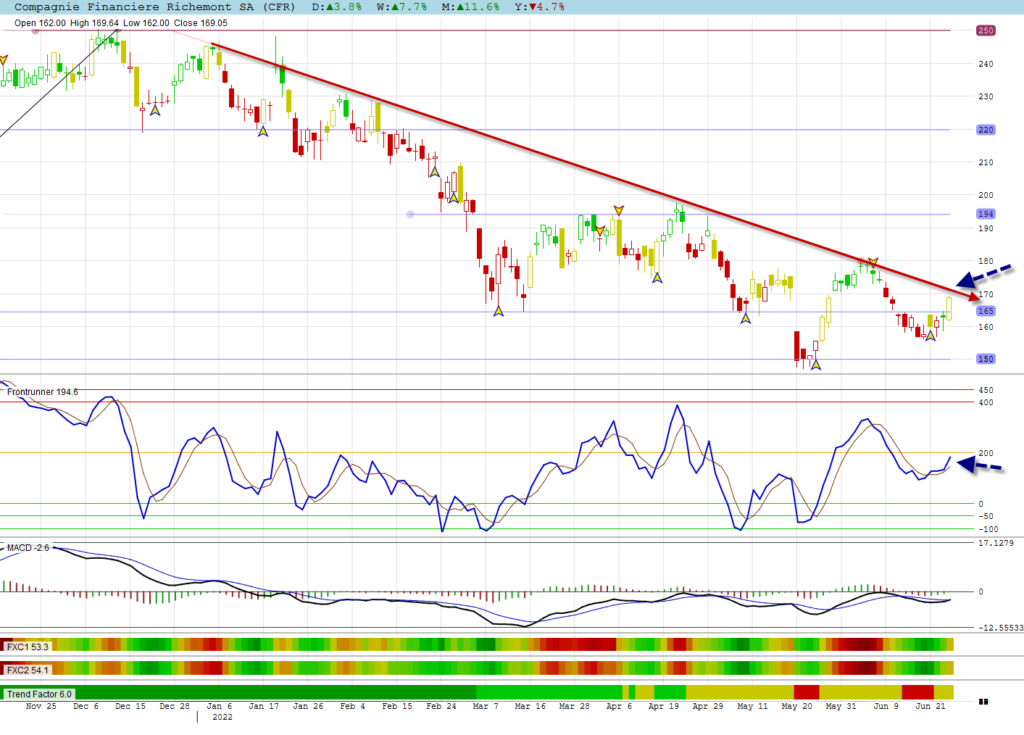
Compagnie Financiere Richemont SA
Compagnie Financiere Richemont SA completed a large J-curve correction and can attempt to break the negative trend line.
Algomodel Startegies, Education & Features
Click on Education or go to the home page to view education posts.
Frontrunner, Gaps, Trend and Cyclic Indicators are explained in these education posts.
All stock graphs are shown with a Trend Candles Template which is a feature available in Algomodel Signals Pro.