
I will post the lesson about candlesticks after this review. There are many books and articles on the web that cover the subject in depth if you are interested in the philosophy and why these shapes are forming. We categorized the candlestick patterns under appropriate headings for easy reference.
Bloomberg:
- Morgan Stanley’s big bear sees temporary respite from selloff
- Coinbase sinks as Goldman downgrade to sell after 75% rout
MarketWatch:
- A slumping stock market may be due for a ‘seasonal pick-me-up,’ history shows
- Wall street bear who called stock-market selloff sees S&P 500 up another 7% before turning lower
Some profit taking stepped in after the previous strong day.
Global Indexes
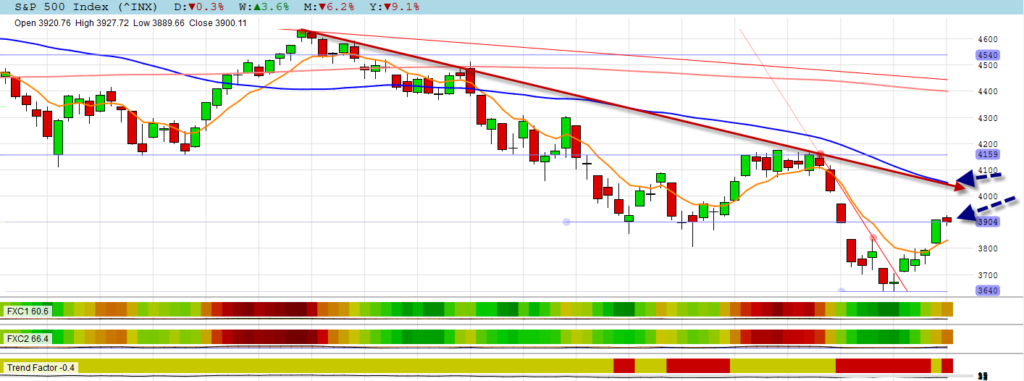
S&P 500
The S&P 500 is hesitant with a small body candle after the strong day as profit taking stepped in.
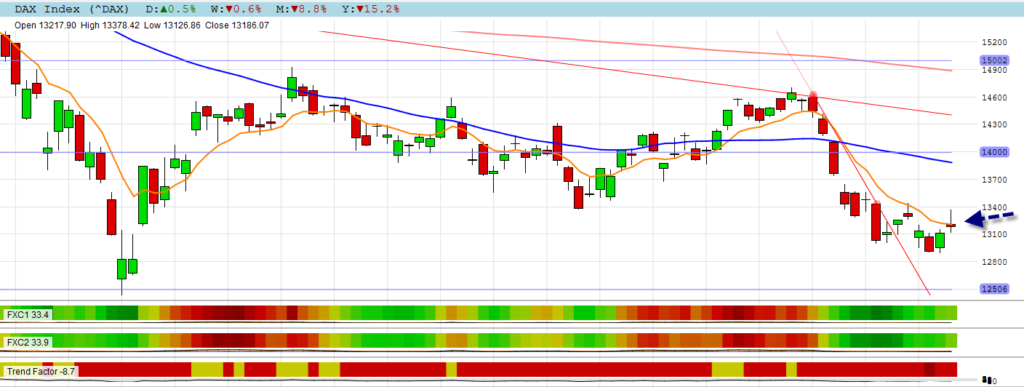
DAX
Although the DAX moved positive for the day, it could not break its EMA line and ended with an unsure candle (see new lesson).
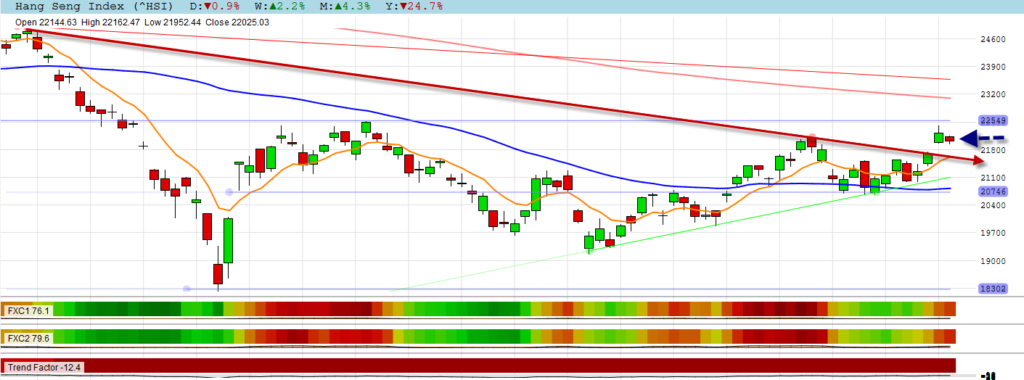
HANG SENG
Another unsure candle for the HANG SENG in the form of a small body candle.
NYSE & NASDAQ Stocks
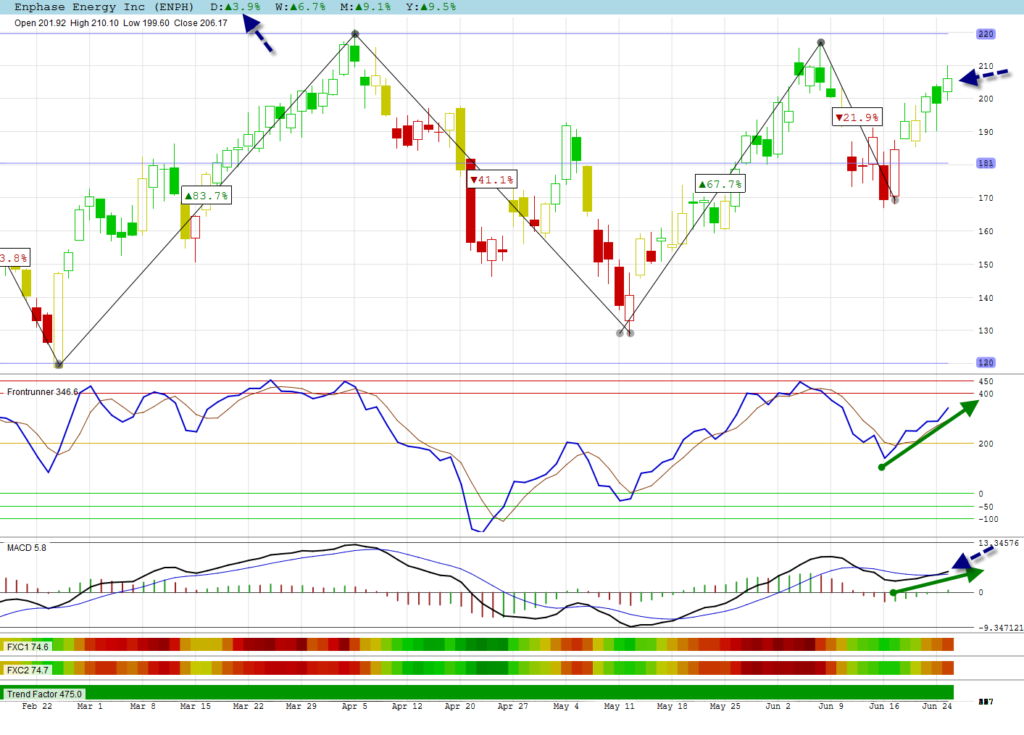
Enphase Energy Inc
Our strongest trend share in the S&P500, Enphase Energy Inc, continued its positive trend. When you look at the candle lesson you will see that the previous candle was not a piercing candle as its body did not cross the 50% level of the previous candle. The lagging MACD even broke its average line to be in positive territory.
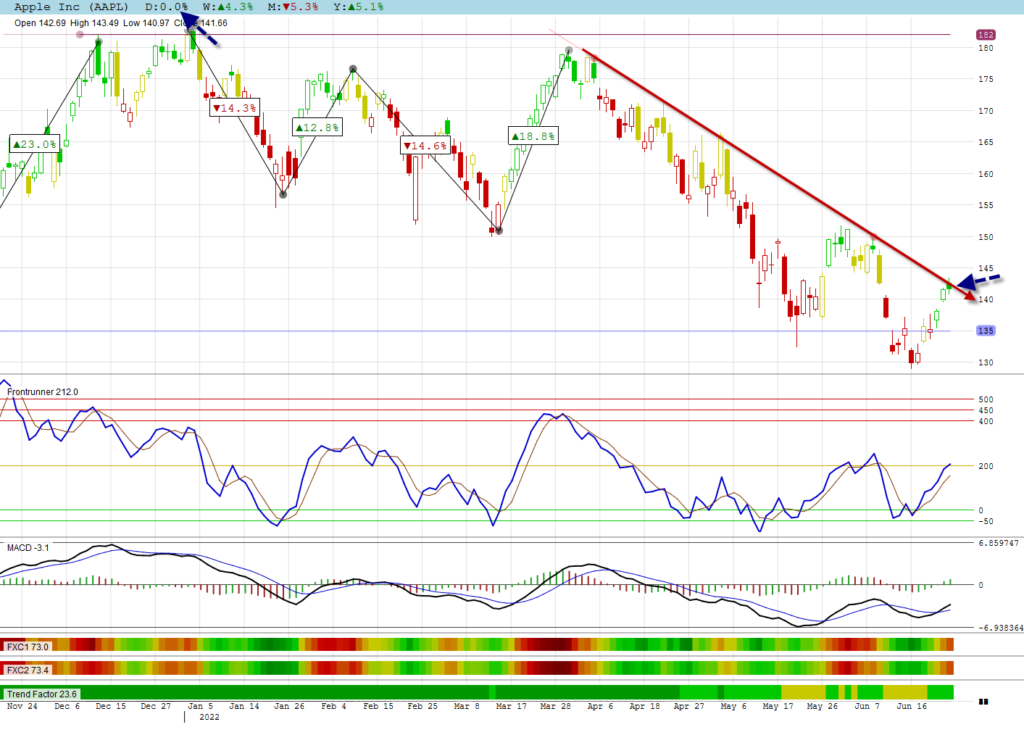
Apple Inc
Apple Inc is also hesitating on my negative trend line. We will have to wait to see how this candle formation develops. Spinning top or will the next move break the trend line?
JSE Stocks
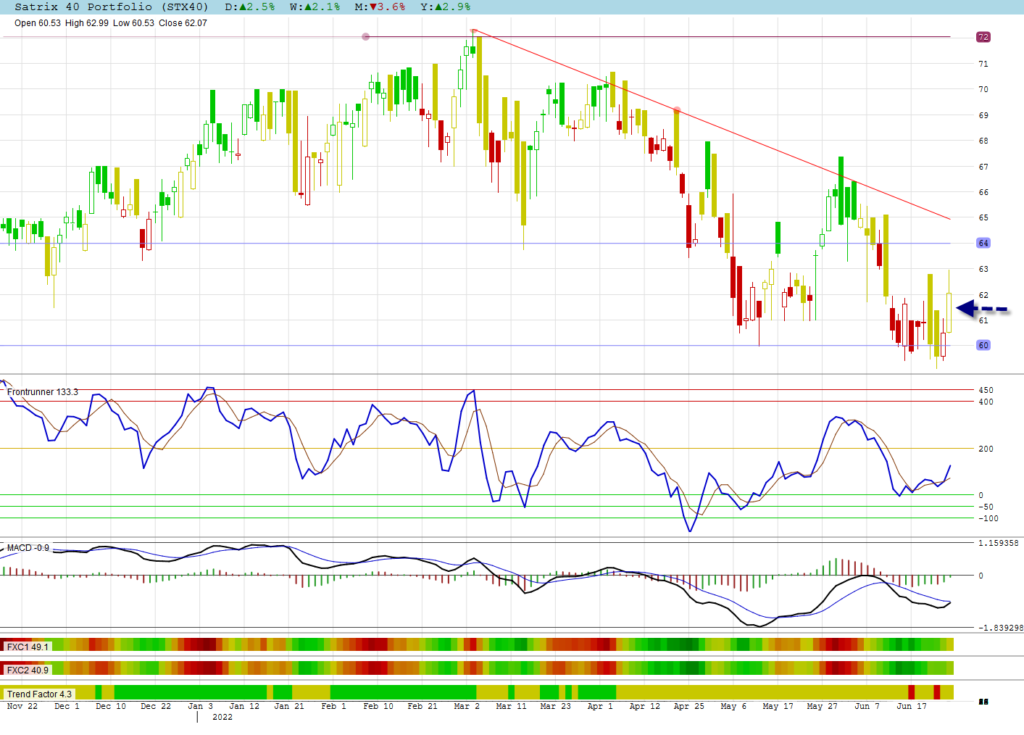
Satrix 40 Portfolio
The Satrix 40 Portfolio was lifted due to the strong move of Naspers and Prosus.
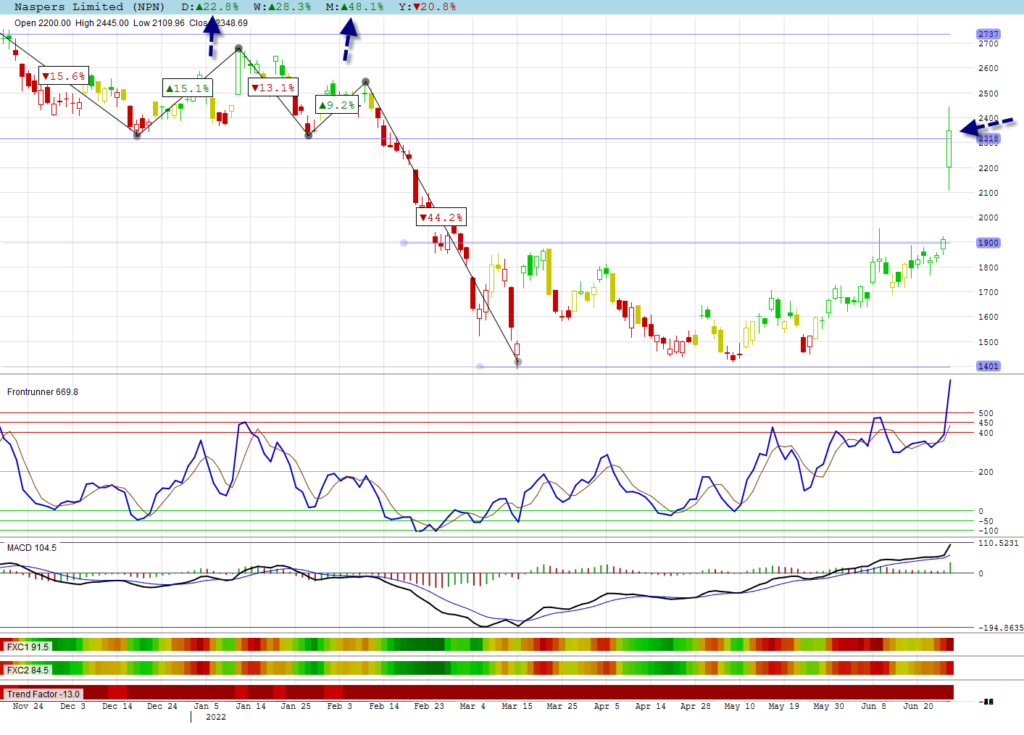
Naspers Limited
Naspers made one large rising window with its gain of 22.8%. Naspers and Prosus are selling off Tencent stake to fund share buyback.
Algomodel Startegies, Education & Features
Click on Education or go to the home page to view education posts.
Frontrunner, Gaps, Trend and Cyclic Indicators are explained in these education posts.
All stock graphs are shown with a Trend Candles Template which is a feature available in Algomodel Signals Pro.