Among the first people in Japan to use past prices to predict future price movements was Munehisa Homma, making a huge fortune trading in the rice market during the 1700s. However, according to Steve Nison, the candlestick chart pattern technique did not become popular until the 1850s when more rice traders started using it.
In Algomodel Signals Pro we combine this Eastern method of technical analysis with Western methods and enhanced it.
Basic Candle
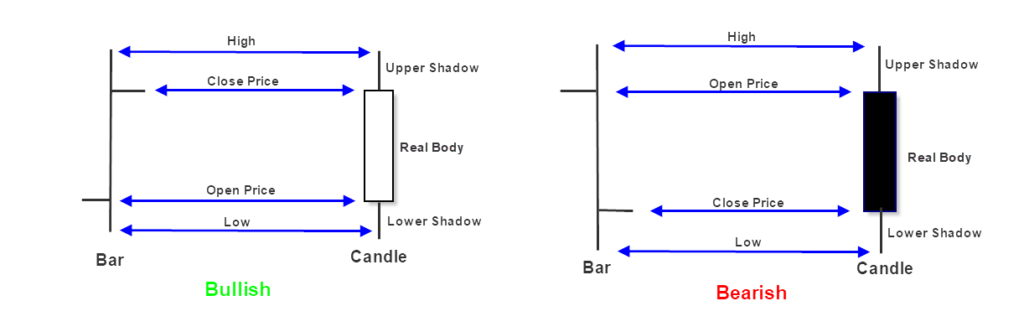
A hollow candle forms when the stock closes higher than its opening price.
A solid (or filled) candle forms when the stock closes lower than its opening price.
With a Trend candles template we classified the candlesticks into 3 colors to identify their trend:
- Green: Positive Trend
- Yellow: Trend change or Indecision
- Dark Red: Negative Trend
Doji’s
The Japanese say that whenever a Doji appears, always take notice. When a Doji appears at the top of a trend, in an overbought area or at the bottom of an extended downtrend in oversold area, one should consider taking profit or buying. The next day’s move would confirm a new direction.
The Doji signal is composed of one candle. It is formed when the open and the close occur at the same level or very close to the same level in a specific timeframe. In Candlestick charting, this essentially creates a “cross” formation. As the following illustrations demonstrate, the horizontal line represents the open and close occurring at the same level. The vertical line represents the total trading range during that time frame.
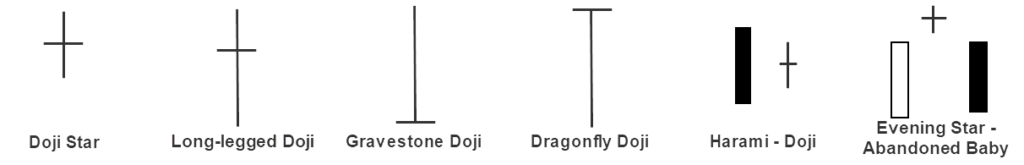
- Doji Star: Upon seeing a Doji in an overbought or oversold condition, an extremely high probability reversal situation is probable. Overbought or oversold conditions are defined as Heatmaps in Algomodel Signals Pro. When a Doji appears, it is demonstrating that there is indecision now occurring at an extreme portion of a trend.
- Long-legged Doji: The Long-legged Doji is composed of long upper and lower shadows. Throughout the time period, the price moved up and down dramatically before it closed at or very near the opening price. This reflects the great indecision that exists between the bulls and the bears.
- Gravestone Doji: The Gravestone Doji is formed when the open and the close occur at the low end of the trading range. The price opens at the low of the day and rallies from there, but by the close the price is beaten back down to the opening price. The Japanese analogy is that it represents those who have died in battle. The victories of the day are all lost by the end of the day. A Gravestone Doji, at the top of the trend, is a specific version of the Shooting Star. At the bottom, it is a variation of the Inverted Hammer.
- Dragonfly Doji: The Dragonfly Doji occurs when trading opens, trades lower, then closes at the open price which is the high of the day. At the top of the market, it becomes a variation of the Hanging Man. At the bottom of a trend, it becomes a specific Hammer. An extensively long shadow on a Dragonfly Doji at the bottom of a trend is very bullish.
- Harami – Doji: A two candlestick pattern in which a doji holds within the prior session’s unusually large real body. It is an important top or bottom reversal signal. For a top reversal the first candle will be a bullish one and for a bottom reversal a bearish candle.
- Evening Doji Star – Abandoned Baby: This is a major reversal pattern formed by three candlesticks. The first is a tall white real body, the second is a doji which gaps higher (exhaustion gap) and the third is a bearish candle that closes well into the first sessions real white body. This is considered more bearish than a regular evening star pattern, because of the doji.
Bullish Reversal Candlestick Patterns
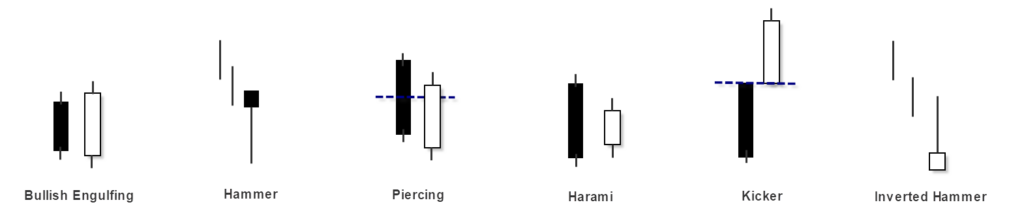
- Bullish Engulfing Pattern: The Bullish Engulfing Pattern forms after a downtrend. It opens lower that the previous day’s close and closes higher than the previous day’s open. Thus, the white candle completely engulfs the previous day’s bearish candle.
- Hammer Signal: It is easily identified by the presence of a small body with a shadow at least two times greater than the body. Found at the bottom of a downtrend, this shows evidence that the bulls started to step in. The color of the small body is not important but a white candle has slightly more bullish implications than the black body. A positive day is required the following day to confirm this signal.
- Piercing Pattern: The Piercing Pattern is composed of a two-candle formation in a downtrending market. The first candle is black, a continuation of the existing trend. The second candle is formed by opening below the low of the previous day. It closes more than midway up the black candle, near or at the high for the day.
- Bullish Harami: The Harami is an often seen formation. The pattern is composed of a two candle formation in a down-trending market. The body of the first candle is the same color as the current trend. The first body of the pattern is a long body, the second body is smaller. The open and the close occur inside the open and the close of the previous day. It’s presence indicates that the current trend is over.
- Bullish Kicker: The Kicker signal is the most powerful signal of all. It works equally well in both directions. Its relevance is magnified when occurring in the overbought or oversold area. It is formed by two candles. The first candle opens and moves in the direction of the current trend. The second candle opens at the same open of the previous day, a gap open, and heads in the opposite direction of the previous day’s candle. The bodies of the candles are opposite colors. This formation is indicative of a dramatic change in investor sentiment.
- Inverted Hammer: The Inverted Hammer is comprised of one candle. It is easily identified by the small body with a shadow at least two times greater than the body. Found at the bottom of a downtrend, this shows evidence that the bulls are stepping in, but the selling is still going on. The color of the small body is not important but the white body has more bullish indications than a black body. A positive day is required the following day to confirm this signal.
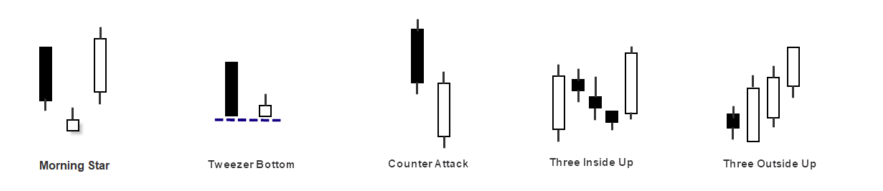
- Morning Star Pattern: The Morning Star is a bottom reversal signal. Like the planet Mercury, the morning star, it foretells that brighter things – sunrise, is about to occur, or that prices are going to go higher. It is formed after an obvious downtrend. It is made by a long black body, usually one of the fear-induces days at the bottom of a long decline. The following day gaps down. However, the magnitude of the trading range remains small for the day. This is the star of the formation. The third day is a white candle day. And represents the fact that the bulls have now stepped in and seized control. The optimal Morning Star signal would have a gap before and after the star day.
- Tweezer Bottom: It consists of three candlesticks, the first being a long bearish candle, the second candlestick being a small bullish candle which should be in the range the first candlestick. Both the candlesticks make almost or the same low. When the Tweezer Bottom candlestick pattern is formed the prior trend is a downtrend.
- Bullish Counter Attack: The pattern is called a neckline because the two closing prices are the same or almost the same across the two candles, forming a horizontal neckline. There must be a strong downtrend in the market for the formation of the bullish counterattack pattern. The first candle must be a long black real body candle. The second candle must also be a long (ideally, equal in size to the first candle) but a white real body candle. The second candle must close near the close of the first candle.
- Three Inside Up: The three inside up pattern consists of three candles, a large down candle, a smaller up candle contained within the real body of the prior candle and then another up candle that closes above the close of the second candle.
- Three Outside Up: The pattern requires three candles to form in a specific sequence. The first candle is a small down candle, the second candle an engulfing bull candle followed by another bull candle.
Bearish Reversal Candlestick Patterns
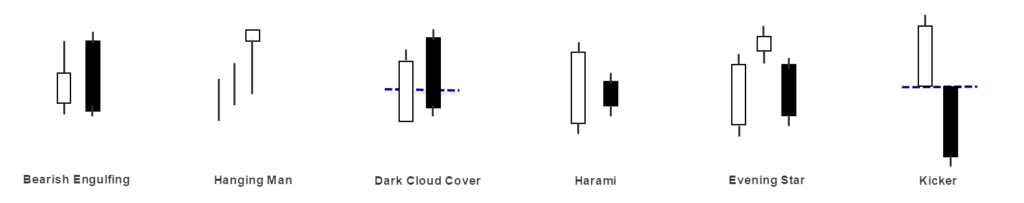
- Bearish Engulfing Pattern: The Bearish Engulfing Pattern is formed after an up trend. It opens higher than the previous day’s close and closes lower than the previous day’s open. Thus, the black candle completely engulfs the previous day’s white candle. Engulfing can include either the open or the close be equal to the open or close of the previous day, but not both.
- Hanging Man: It is easily identified by the presence of a small body with a shadow at least two times greater than the body. It is found at the top of an up trend. The Japanese named this pattern because it looks like a head with the feet dangling down.
- Dark Cloud Cover: The dark Cloud Cover is the bearish counterpart to the Piercing pattern. The first day of the pattern is a long white candle at the top end of a trend confirming the bull trend. The second day’s open is higher that the high of the previous day and it closes more than 50% into the the real body of the previous candle. The further down the white candle, the more convincing the reversal. Remember that a close at or below the previous day’s open turns this pattern into a Bearish Engulfing pattern.
- Bearish Harami: The Bearish Harami is the exact opposite of the Bullish Harami. The pattern is composed of a two-candle formation. The body of the first candle is the same color as the current trend. The first body of the pattern is a long body; the second body is smaller. The open and the close occur inside the open and the close of the previous day. Its presence indicates that the trend is over.
- Evening Star Pattern: The Evening Star pattern is a top reversal signal made up of 3 candles. It is exactly the opposite of the Morning Star signal. Like the planet Venice , the evening star, it foretells that darkness is about to set or that prices are going to go lower. The first candle of the pattern is a long white body occurring at the end of an uptrend. The following day gaps up, yet the trading range remains small for the day. This is the star of the formation. The third day is a black candle day and represents the fact that the bears have now seized control. That candle should consist of a closing that is at least halfway down the white candle of two days prior. The optimal Evening Star signal would have a gap before and after the star day and be completely out of the real bodies of first and third candle.
- Bearish Kicker: The Kicker signal is the most powerful signal of all. It works equally well in both directions. Its relevance is magnified when occurring in the overbought or oversold area. It is formed by two candles. The first candle opens and moves in the direction of the current trend. The second candle opens at the same open of the previous day, a gap open, and heads in the opposite direction of the previous day’s candle. The bodies of the candles are opposite colors. This formation is indicative of a dramatic change in investor sentiment.
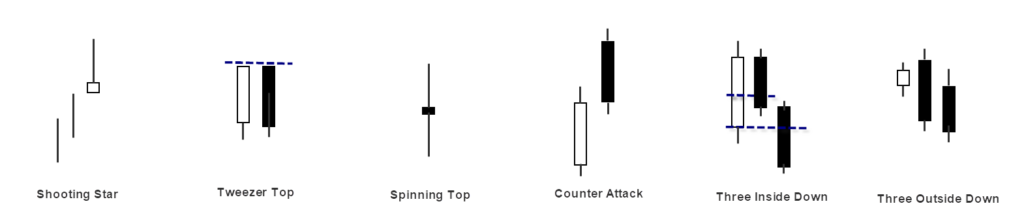
- Shooting Star: The Shooting Star is comprised of one candle. It is easily identified by the presence of a small body with a shadow at least two times greater than the body. It is found at the top of an uptrend. The Japanese named this pattern because it looks like a shooting star falling from the sky with the tail trailing it. Needs confirmation the next day with a black candle or gap with lower close.
- Tweezer Top: The Tweezer Top pattern is a bearish reversal candlestick pattern that is formed at the end of an uptrend. It consists of two candlesticks, the first one being bullish and the second one being a bearish candlestick. Both the tweezer candlesticks should almost be at the same high.
- Spinning Top: A candlestick with a small real body. The only difference between spinning top and doji is in their formation, the real body of the spinning is larger as compared to a Doji.
- Bearish Counter Attack: The pattern is called a neckline because the two closing prices are the same or almost the same across the two candles, forming a horizontal neckline. There must be a strong uptrend in the market for the formation of the bearish counterattack pattern. The first candle must be a long white real body candle. The second candle must also be a long (ideally, equal in size to the first candle) but a black real body candle. The second candle must close near the close of the first candle.
- Three Inside Down: The three inside down pattern consists of three candles, a large up candle, a smaller down candle contained within the real body of the prior candle and then another down candle that closes below the close of the second candle.
- Three Outside Down: The pattern requires three candles to form in a specific sequence. The first candle is a short bullish, the second candle an engulfing bear candle followed by another bear candle.
Bullish Continuation Candlestick Patterns
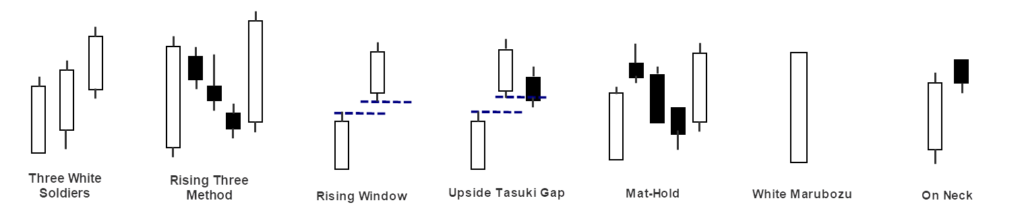
- Three White Soldiers: A group of three long bullish bodies which do not have long shadows and with consecutively higher closes with each of the closes near the highs of the session.
- Rising Three Method: The rising three methods is a bullish, five candle continuation pattern which signals an interruption, but not a reversal, of the ongoing uptrend. The candlestick pattern is made of two long candlesticks in the direction of the trend at the beginning and end, with three shorter counter-trend candlesticks in the middle.
- Rising Window: The rising window is a candlestick pattern consisting of two bullish candlesticks with a gap between them. The gap is a space between the high and low of two candlesticks that occurs due to high trading volatility.
- Upside Tasuki Gap: This candlestick pattern consists of three candles, the first candlestick is a long-bodied bullish candlestick, and the second candlestick is also a bullish candlestick chart formed after a gap up. The third candlestick is a bearish candle that closes or partially closes in the gap formed between these first two bullish candles.
- Bullish Mat-Hold: A bullish pattern begins with a large bullish candle followed by a gap higher and three smaller candles which move lower.
- White Marubozu: The white Marubozu candle indicates that buyers controlled the price of the stock from the opening bell to the close of the day, and is considered very bullish. This candlestick has a long bullish body with no upper or lower shadows.
- Bullish On Neck Pattern: The on neck pattern occurs when a long real bodied down candle is followed by a smaller real bodied up candle that gaps down on the open but then closes near the prior candle’s close. The pattern is called a neckline because the two closing prices are the same (or almost the same) across the two candles, forming a horizontal neckline. The pattern is theoretically considered a continuation pattern, indicating that the price will continue lower following the pattern. The pattern also often indicates at least a short-term reversal higher.
Bearish Continuation Candlestick Patterns
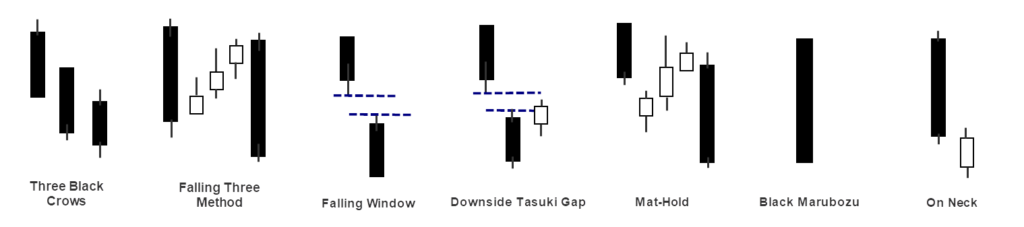
- Three Black Crows: A group of three long bearish bodies which do not have long shadows and with consecutively lower closes with each of the closes near the lows of the session.
- Falling Three Method: The falling three methods is a bearish, five candle continuation pattern which signals an interruption, but not a reversal, of the ongoing downtrend. The candlestick pattern is made of two long candlestick charts in the direction of the trend at the beginning and end, with three shorter counter-trend candlesticks in the middle.
- Falling Window: The falling window is a candlestick pattern that consists of two bearish candlesticks with a gap between them. The gap is a space between the low and high of two candlesticks.
- Downside Tasuki Gap: This candlestick pattern consists of three candles, the first candlestick is a long-bodied bearish candlestick, and the second candlestick is also a bearish candlestick formed after a gap down. The third candlestick is a bullish candle that closes or partially closes in the gap formed between these first two bearish candles.
- Bearish Mat-Hold: A bearish pattern begins with a large bearish candle followed by a gap lower and three smaller candles which move higher.
- Black Marubozu: A black Marubozu candle has a long black body and is formed when the open equals the high and the close equals the low. This candlestick has a long bearish body with no upper or lower shadows which shows that the bears are exerting selling pressure.
- Bearish On Neck Pattern: The on neck pattern occurs when a long real bodied up candle is followed by a smaller real bodied down candle that gaps up on the open but then closes near the prior candle’s close. The pattern is called a neckline because the two closing prices are the same (or almost the same) across the two candles, forming a horizontal neckline. The pattern is theoretically considered a continuation pattern, indicating that the price will continue higher following the pattern. The pattern also often indicates at least a short-term reversal lower.
Indecision Patterns
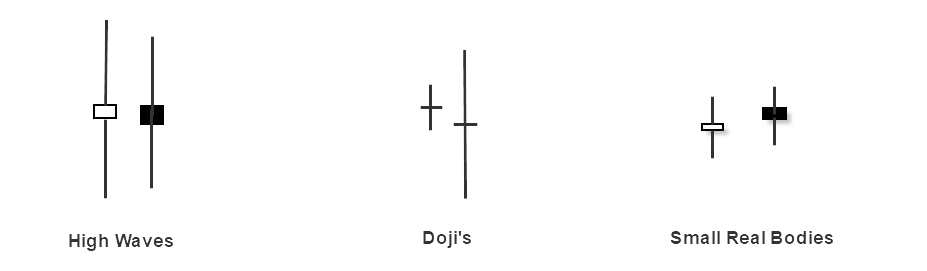
- High Wave: It mostly occurs at support and resistance levels that shows the market is neither bullish nor bearish. This is where bears and bulls battle each other in the effort of trying to push the price in a given direction. Candlesticks depict the pattern with long lower shadows and long upper shadows and they have small bodies. The long shadows signal there was a large amount of price movement during the given period. However, the price ultimately ended up closing near the opening price. High wave candlesticks portray situations where the market is having difficulty coming to a consensus on a value. They are indicative of a market in which uncertainty and indecision prevail. Neither the buyers nor the sellers have a clear sense of which direction the market will head.
- Doji’s & Small real body candlesticks: These candlesticks are similar to high waves as it reflects indecision as neither the bulls nor the bears could take control during the session. The next move then confirms a pattern that could signal a new direction, or continuation of the existing trend. It is most probable that a change of direction will occur if they occur in extreme overbought or oversold conditions.
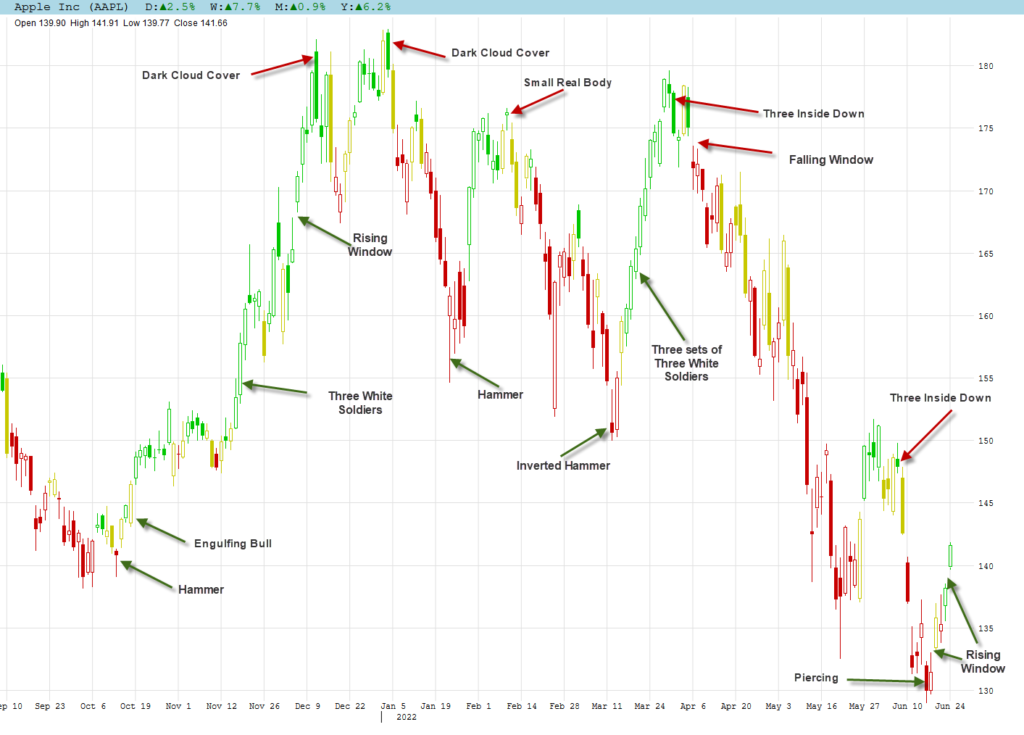
Candlesticks at work on Daily Chart
I marked a few of the candlestick patterns and candles on the daily chart of Apple Inc. See how many more you can identify and whether the prediction of next move was correct?