
Bloomberg:
- Goldman strategists warn risk of stock selloff is still high
- Historic rout in emerging markets sows seeds of outperformance
MarketWatch:
- Forget the 1970s – this market is drawing comparisons to the 1870s
- Recession fears are slamming the stock market
- Mark Zuckerberg issues dire economic warning to Facebook and other meta employees
yahoo! finance:
- Stocks kick off July with gains after worst first half since 1970
- BofA says brace for recession shock after worst rout in 52 years
During such a bear market, be careful of a one day gain. Look at the weekly chart of the Global indexes and they are all below their EMA8 lines except for the Hang Seng. We will show below.
Global Indexes
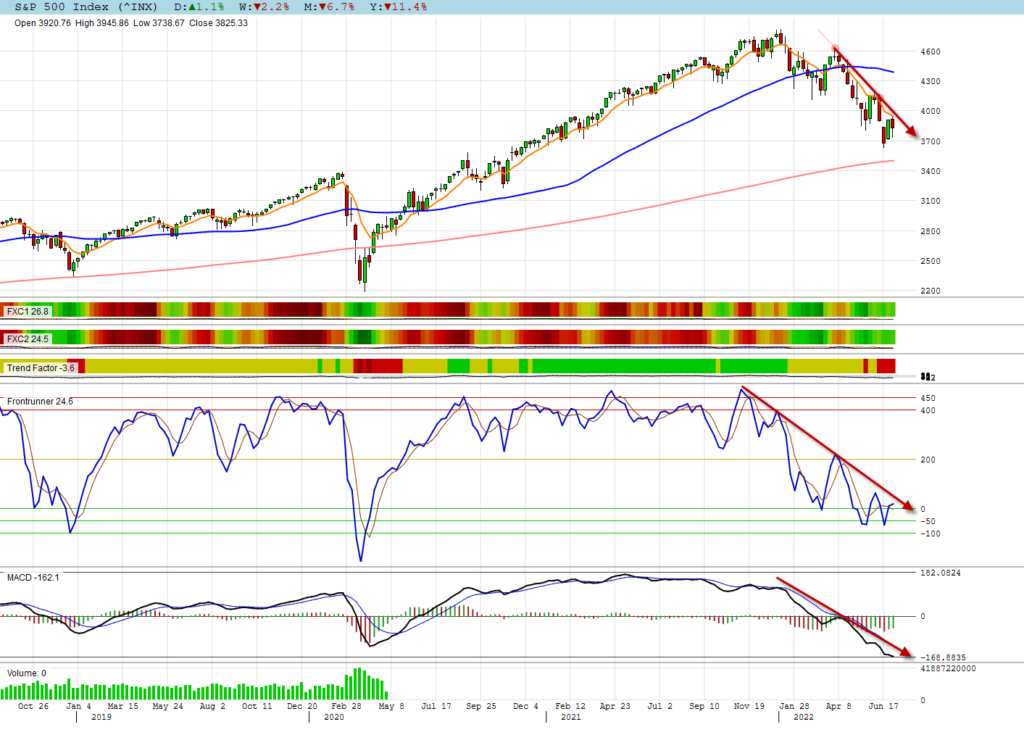
S&P 500
The weekly chart of the S&P 500 remains all negative. Notice that the trend line of Frontrunner and the MACD is also negative.
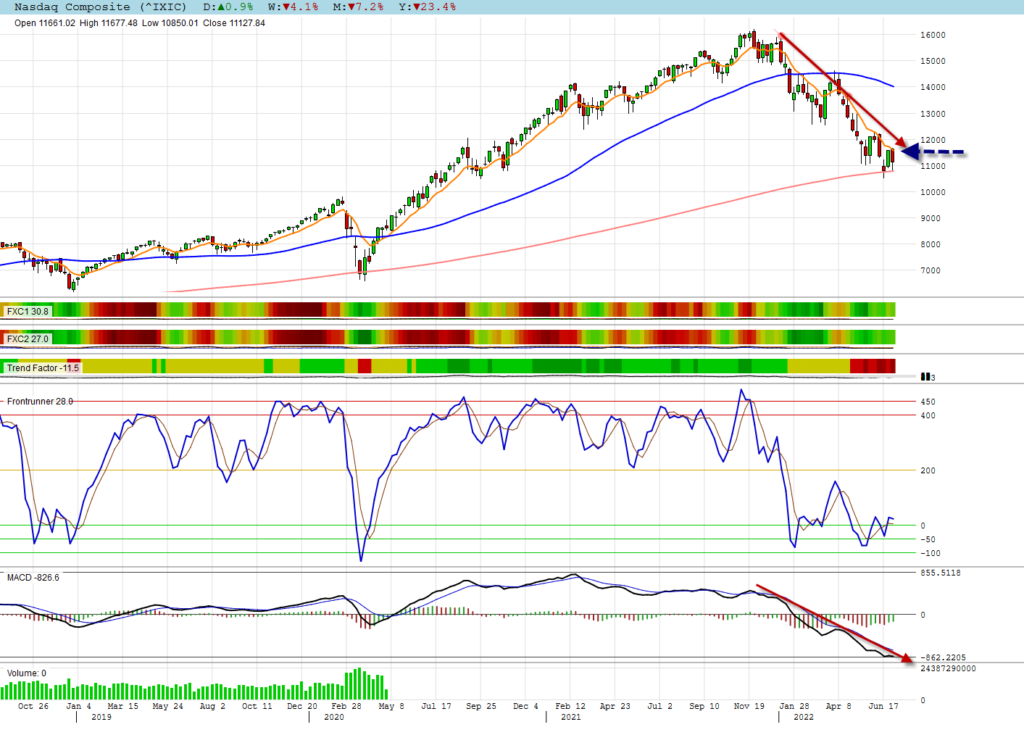
NASDAQ
The weekly chart of the NASDAQ is touching its 200 day moving average. That was the previous turn during February 2020.
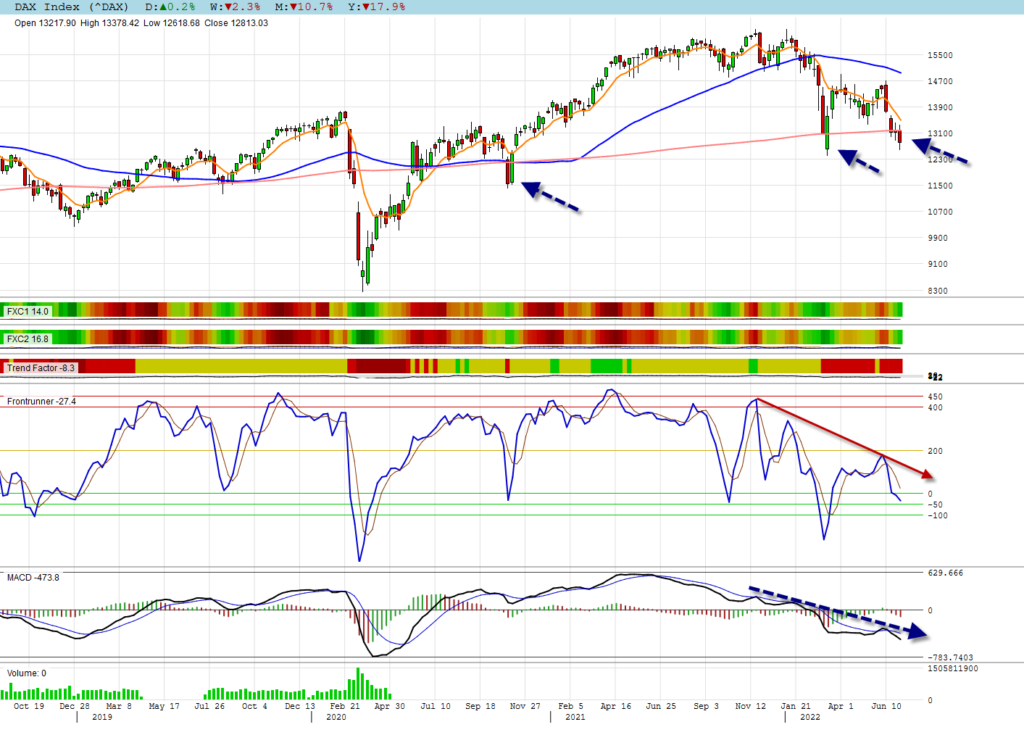
DAX
The weekly chart of the DAX is dipping below its 200 day moving average.
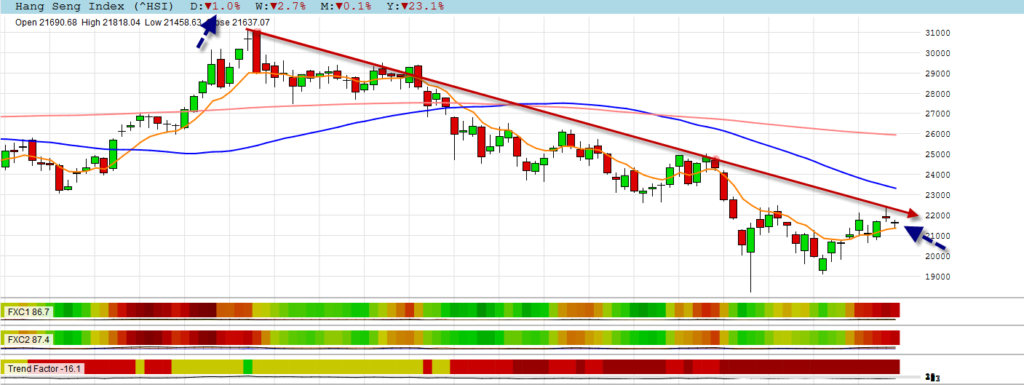
HANG SENG
The weekly chart of the HANG SENG is the only one that is above its EMA8 line, but below its 50 and 200 day moving averages. Notice that the negative trend line is not broken
NYSE & NASDAQ Stocks
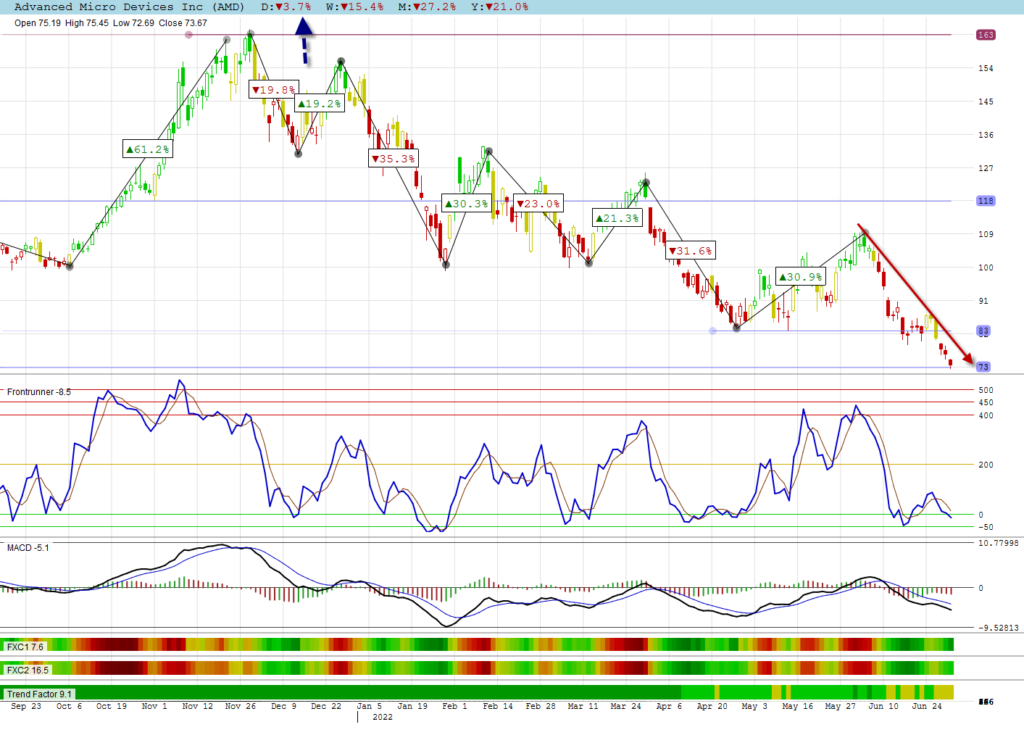
Advance Micro Devices Inc
Advance Micro Devices is still trending downwards.
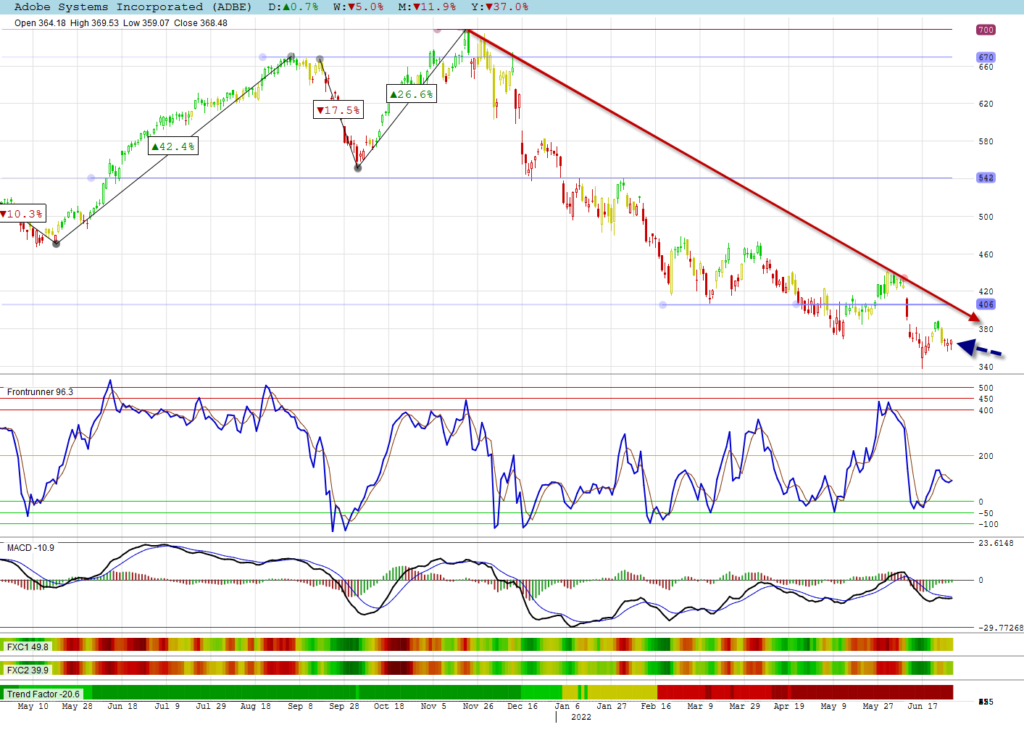
Adobe Systems Incorporated
I saw a presentation last week of a fund that is buying Adobe System stocks. They believe it has value at current levels. Another fund has upgraded it to ‘Hold’ from ‘Strong sell’, but not to ‘Buy’ yet. Worth keeping an eye on this one after falling nearly 50%.
JSE Stocks
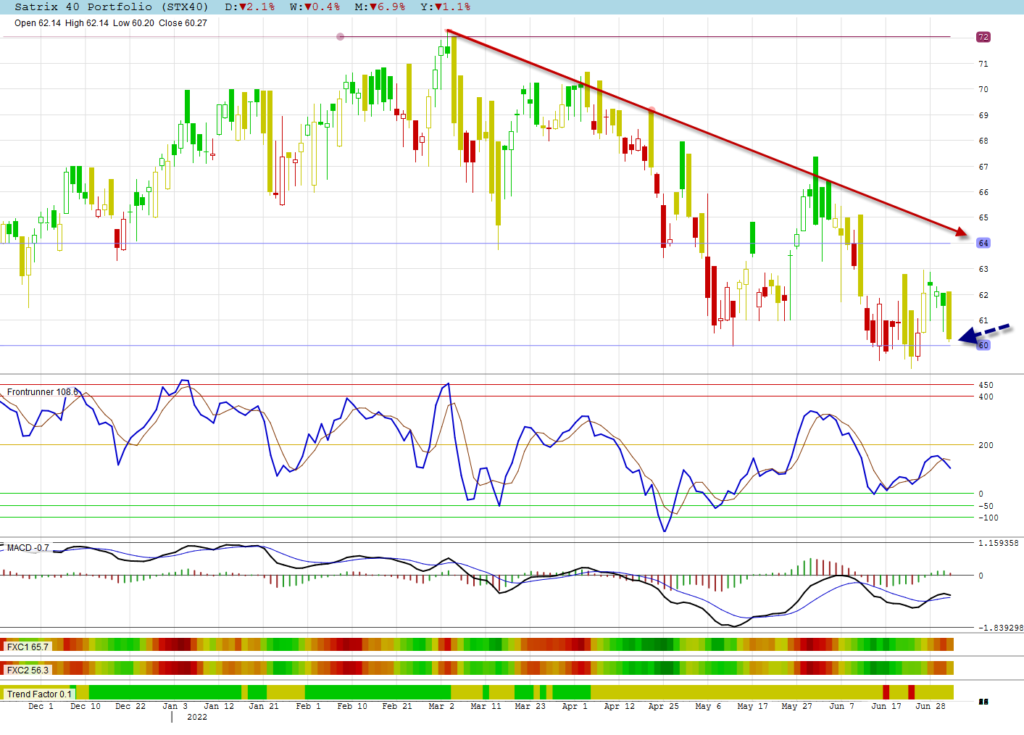
Satrix 40 Portfolio
The Satrix 40 Portfolio loves the 60 level. It corrected back to it together with the correction of Global markets.
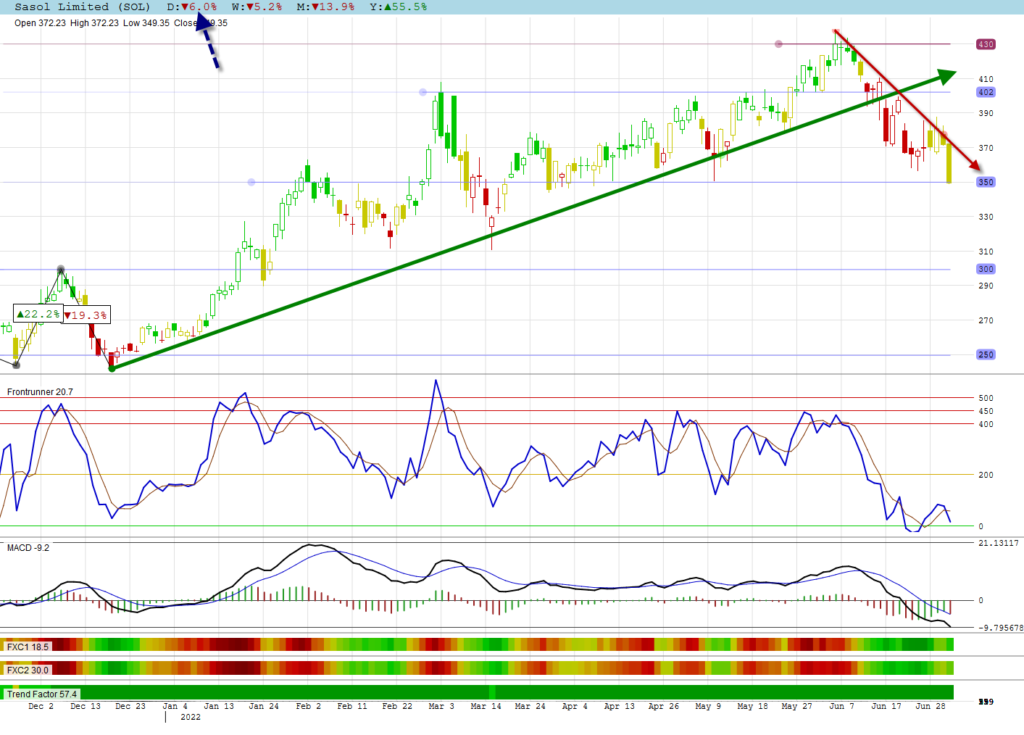
Sasol Limited
The long term positive trend line of Sasol is completely broken with the negative trend line in play. Although oversold, there is no stop in the decline.
Algomodel Startegies, Education & Features
Click on Education or go to the home page to view education posts.
Frontrunner, Gaps, Trend and Cyclic Indicators are explained in these education posts.
All stock graphs are shown with a Trend Candles Template which is a feature available in Algomodel Signals Pro.