In this lesson we want to explore using only Trend Lines as a system to see if it can be a profitable system. The basics of trend lines are explained in Lesson 6.
Trend Lines System
The system is very simple: Buy or Sell when the appropriate trend line gets broken with a closing price.
Buy: When a negative trend line gets broken, enter a long position.
Sell: When a positive trend line gets broken, sell.
Short Selling: Once a positive trend line is broken, the share should be sold or if you are doing short transactions, a short position should be made.
Drawing Trend Lines on Charts
Hind sight is exact science and that makes it easy to draw trendlines on an existing chart. It is much more difficult to draw a trend while it is developing. Short term trendlines lines on daily charts can be very volatile, thus we will concentrate on medium to long term trend lines for the system.
For medium to long term trend lines, the share must be given breathing space to accommodate volatile short term movements. It is the bodies of candles that are important and sometimes long upper and lower shadows can be ignored. If they are taken into account, it gives move breathing space for the volatile moves.
Positive trend line: Can be drawn touching the bottoms of rising share candles. Sometimes you get a better line by ignoring lower shadows and only using the lower body price. The more touches you can get on your trend line, the stronger and accurate the line will be.
Negative trend line: Similar to a negative trend line, but this time drawn on the tops of falling candles or the higher body prices.
Top resistance: A horizontal line touching the tops of candles in a sideways market or a previous high.
Bottom Support: A horizontal line touching the bottoms of candles in a sideways market or a previous low.
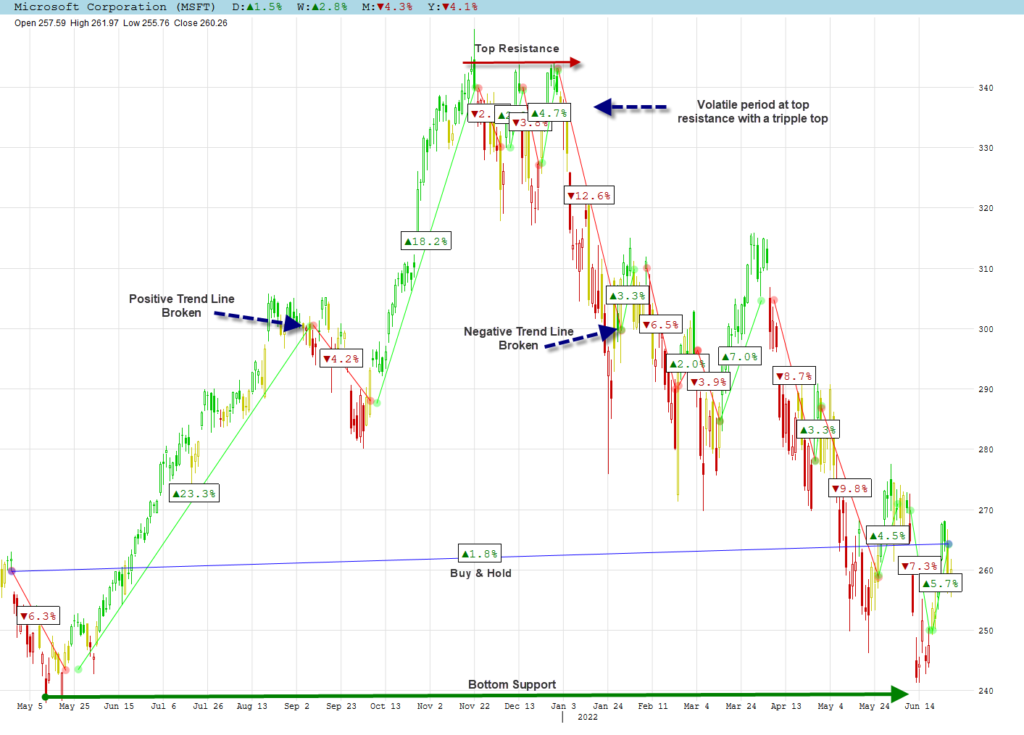
Daily Stock Chart Example
Daily chart of Microsoft Corporation:
- The daily chart can be very volatile and clutter the graph. For that reason we only keep the latest trend line that is active on the chart.
- Upper and lower shadows can sometimes be ignored for a strong trend line, as it is only the closing price of the day that is important. If the closing price breaks the trend, action should be taken.
- Annualized Total Long Positions = 63%; Annualized Total Short Positions = 54%
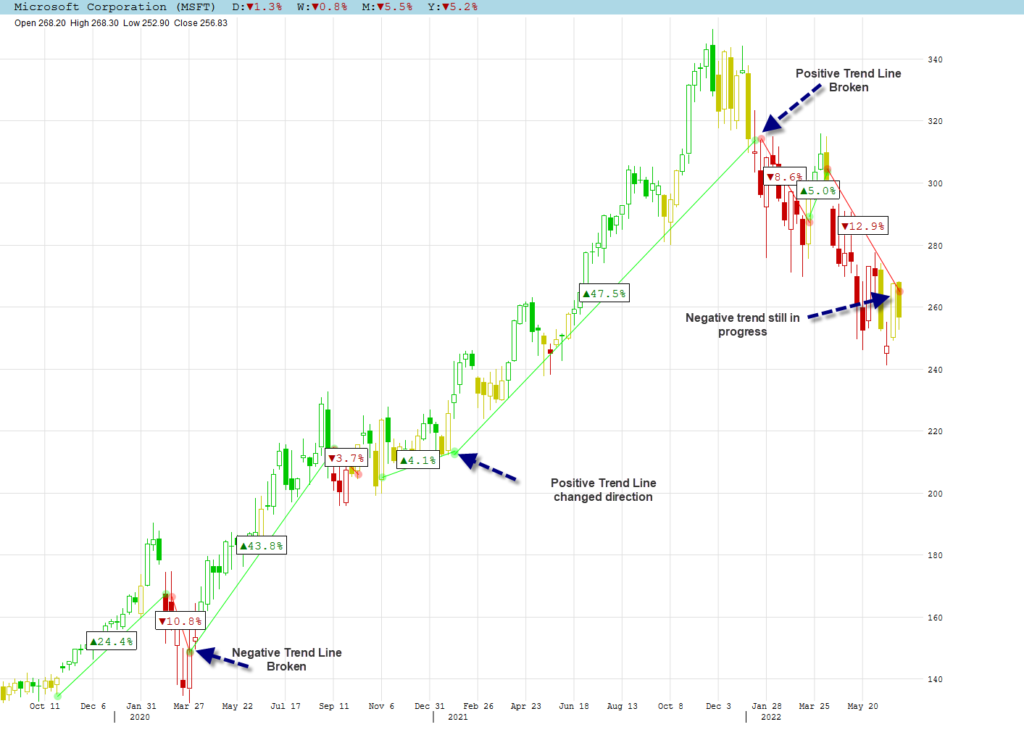
Weekly Stock Chart Example
Weekly chart of Microsoft Corporation:
- Weekly charts are much less volatile as the daily noise is taken up in each weekly bar that is made up of 5 days data.
- Long term trends are more visible on weekly charts.
- We prefer to only use the body extremes to draw strong trend lines, ignoring the large upper and lower shadows.
- Annualized Total Long Positions = 46%; Annualized Total Short Positions = 13%
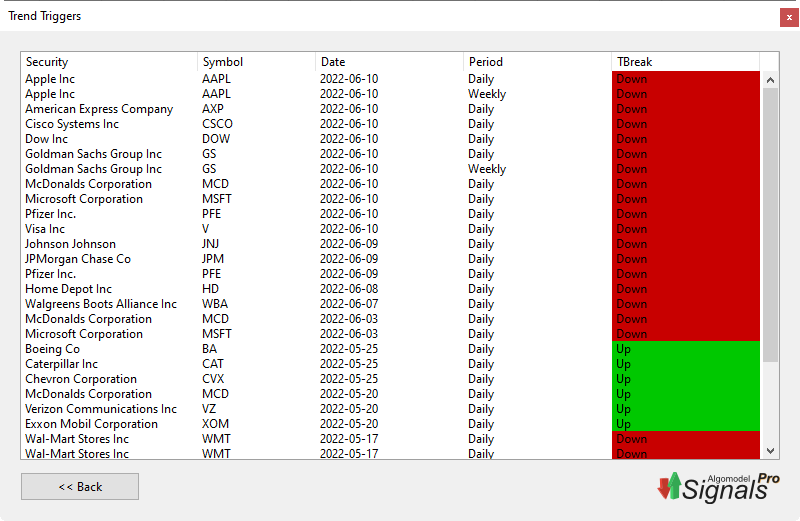
Trend Triggers Exploration
An exploration called Trend Triggers is included in Algomodel Signals Pro to find shares that has broken a trend line.
The exploration summary show all drawn trend lines that are broken on daily and weekly charts. You are able to click on any line to open its chart to view what trend line was broken.