
Bloomberg:
- Nasdaq win streak is fueled by tech losers turning into winners
- Twitter shares sink after Musk says he’s ending acquisition bid
MarketWatch:
- Strong labor market a bulwark against recession as U.S. creates greater-than-forecast 372,000 jobs
- ‘Everybody thinks we’re in a recession, except the labor market’: Economists don’t see signs of downturn in jobs data
- Elon Musk terminates his $44 billion deal to buy Twitter and Twitter’s chairman vows a legal battle
- Hong Kong gambling stocks fall on Macau casino closures
yahoo! finance:
- Jobs data ‘make a mockery ‘ of recession fears
- Gas: ‘Lower pump prices over the next month or so’, analyst
Socks in the U.S. closed flat, but ended the week higher with all major indexes moving positively.
Global Indexes
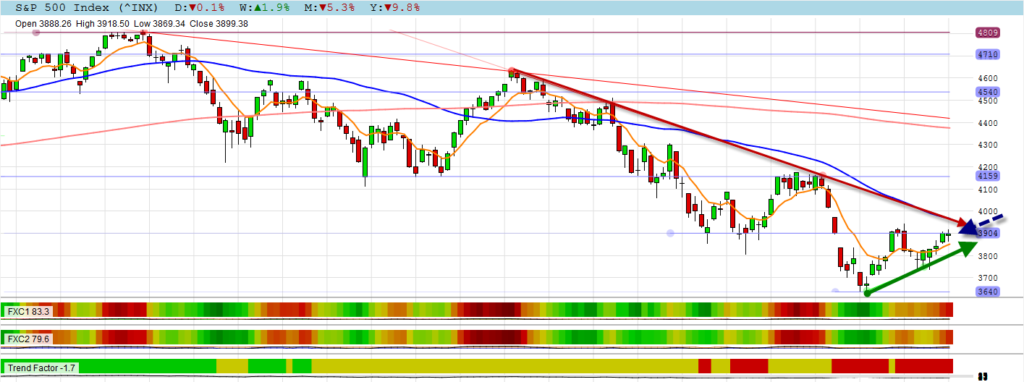
S&P 500
The S&P 500 ended the week flat and only 60 points below strong resistance. Notice how the negative trend line and the 50 day moving average are on top of each other forming the resistance. The positive trend line is also busy forming, but the resistance needs to be broken for the bulls to be in full control!
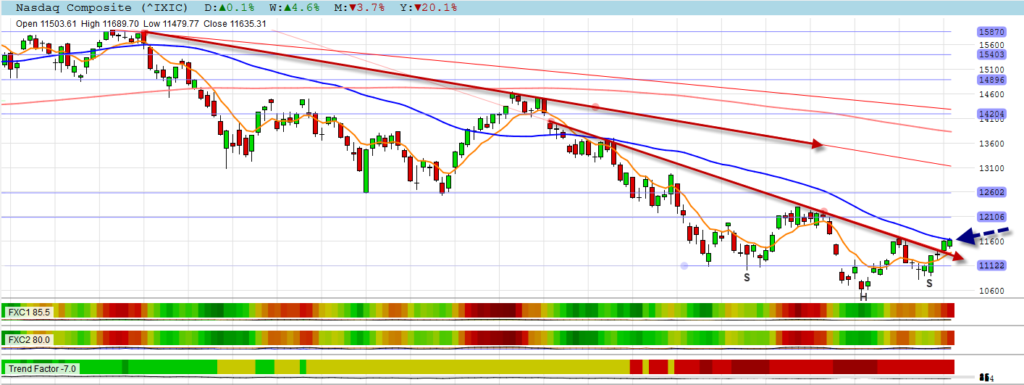
NASDAQ
The NASDAQ closed on its 50 day moving average. It already broke my negative trend line and hold your breath for an average break? A reversed head and shoulder pattern is marked on the graph. If that pattern plays out, it will take the index to the next longer term trend line.
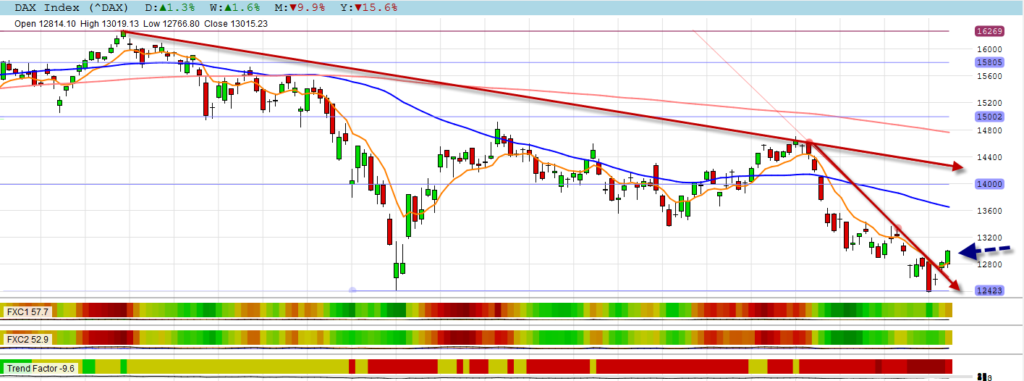
DAX
The DAX broke its short term negative trend and the EMA8 lines. The 50 day moving average (dark blue) is still some distance away.
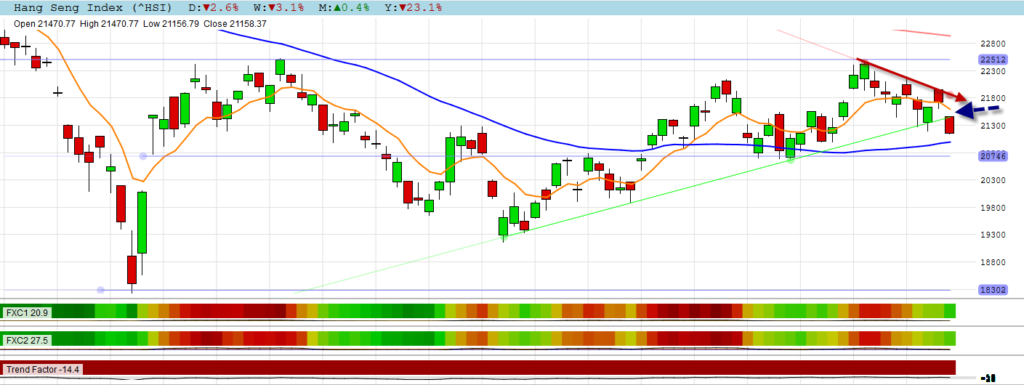
HANG SENG
The HANG SENG made a gap down to trade below its EMA8 and positive trend lines. A new negative trend line is forming with 3 touches.
NYSE & NASDAQ Stocks
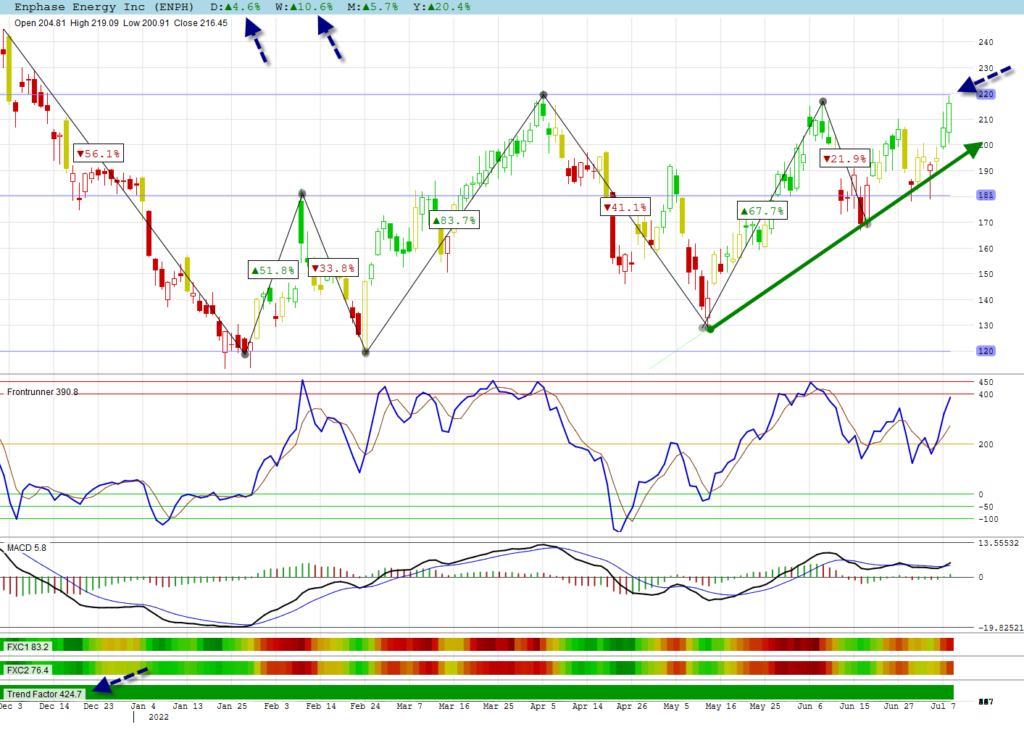
Enphase Energy Inc
Although the S&P 500 ended flat, Enphase Energy continued its strong move and was the best gainer listed on the S&P 500. This is also the share with the strongest trend factor (424).
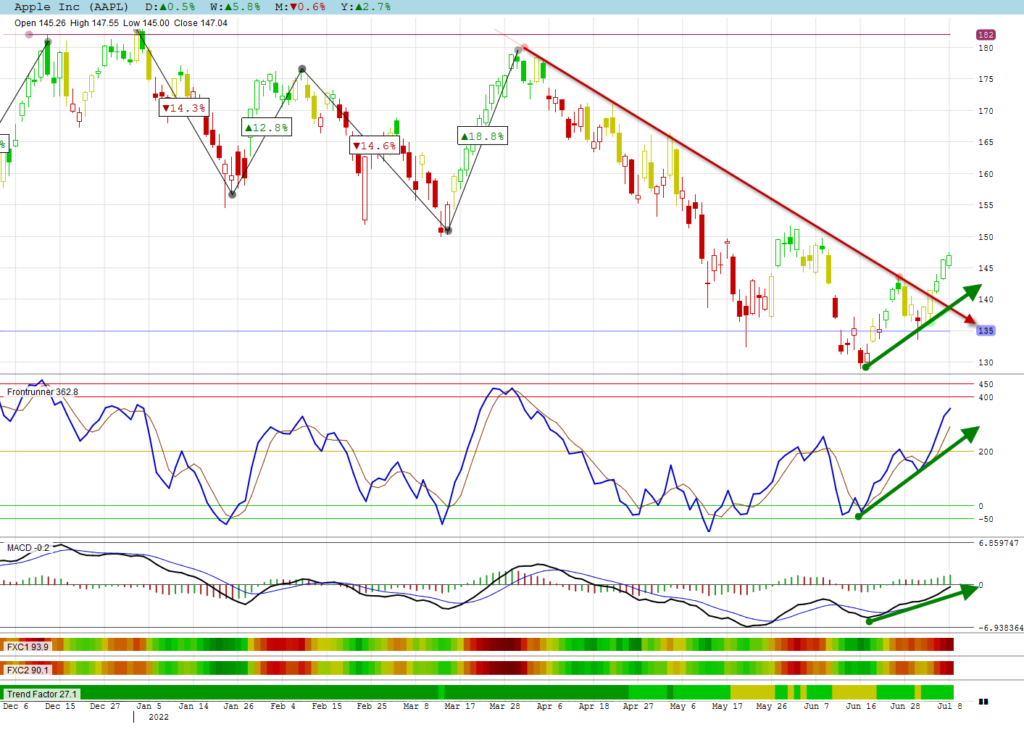
Apple Inc
Apple broke its negative trend line last week and a positive trend line is busy developing. Notice how trend candles turned green after the trend line was broken.
JSE Stocks
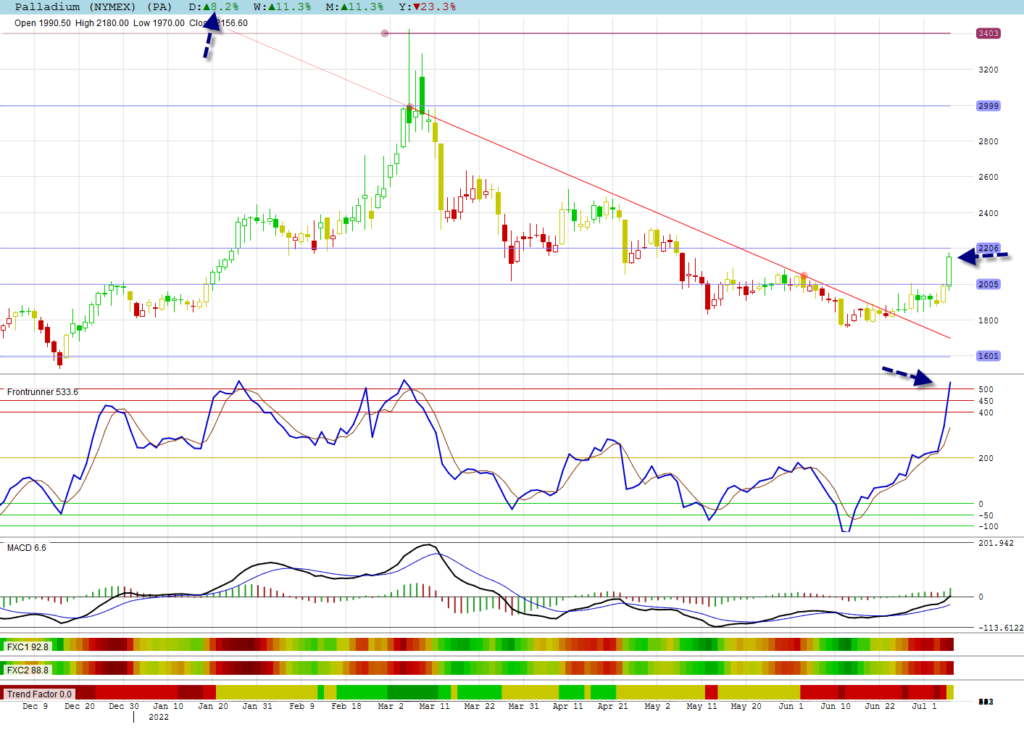
Palladium
I must show the Palladium price that broke out. Frontrunner is predicting more higher prices to come! (See Lesson 8)
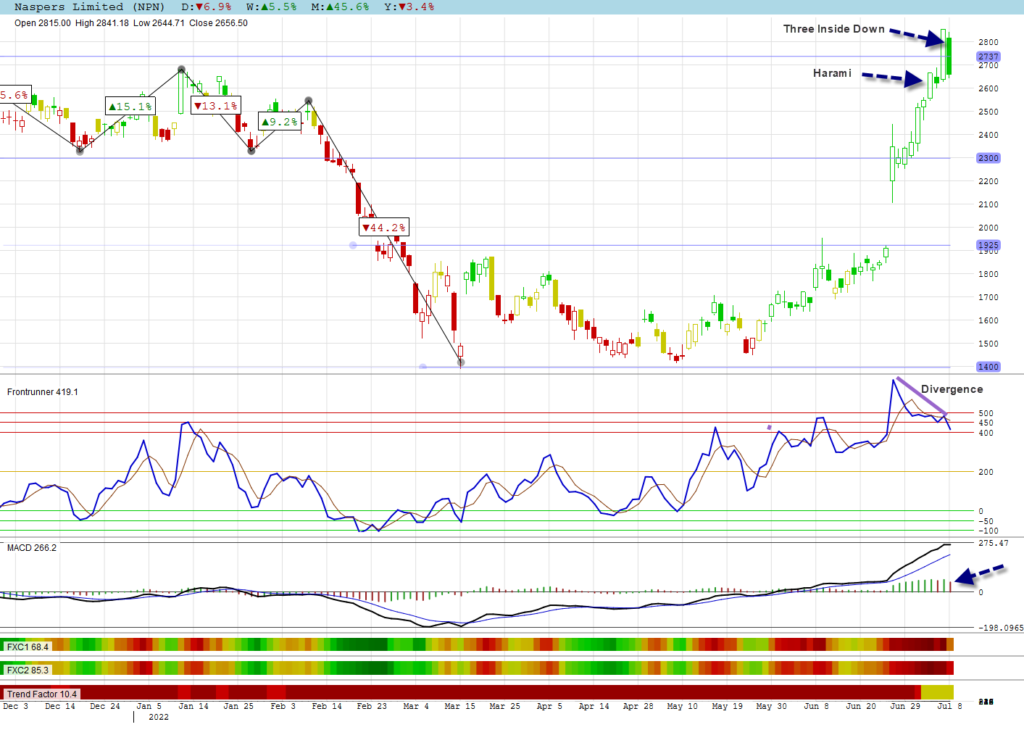
Naspers Limited
Naspers was shown last week when it made the first bearish reversal candle, a harami. It was not confirmed the next day as it made another strong gain. After the strong gain a second bearish candle appeared that could be part of a three inside down bearish reversal pattern. Notice the divergence that is in place and the MACD is starting to make red bars. We are in overbought territory! See lesson 9 for the candlestick pattern explanations.
Algomodel Startegies, Education & Features
Click on Education or go to the home page to view education posts.
Frontrunner, Gaps, Trend and Cyclic Indicators are explained in these education posts.
All stock graphs are shown with a Trend Candles Template which is a feature available in Algomodel Signals Pro.