Lesson 12: MACD Enhanced
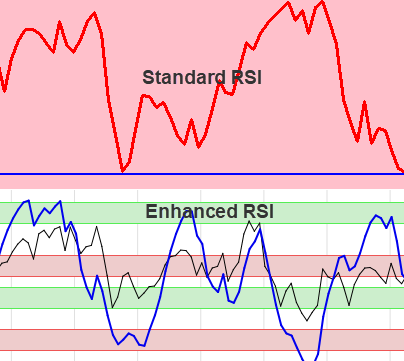
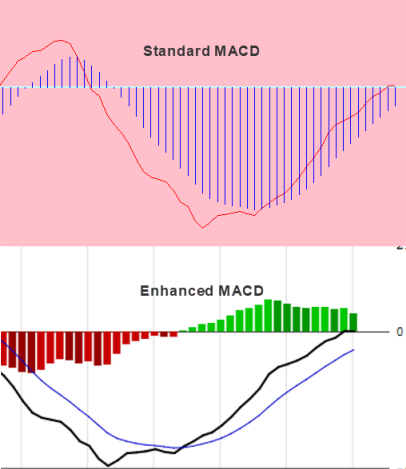
The Moving Average Convergence Divergence (MACD) is a trend-capturing momentum indicator used by professional traders. Standard MACD Indicator The MACD shows the relationship between two moving averages of prices. The MACD was created by Gerald Appel in the late 1970s. The MACD indicator is the difference of the 12-day Exponential Moving Average (EMA) and the […]
Lesson 12: MACD Enhanced Read More »